India has a wealth of data, but using it to make sense of the country is challenging.
First, there are problems of access. Public data is in formats that make it difficult for laypeople to work with, and privately collected data is not always open-access.
Then there are problems of analysis. The terms, measures and methodologies used in large Indian datasets are often not well documented, and, as a result, difficult to parse reliably.
Finally, there are problems of communication. The researchers who do have access to the data often write in academic publications which do not reach the public at large. Data published in the media can be fleeting and the underlying data is often not available to readers.
The result is that most people in India do not have an accurate understanding of key socio-economic issues and do not have a way to answer questions that they might have about what good, reliable data can tell us about the country.
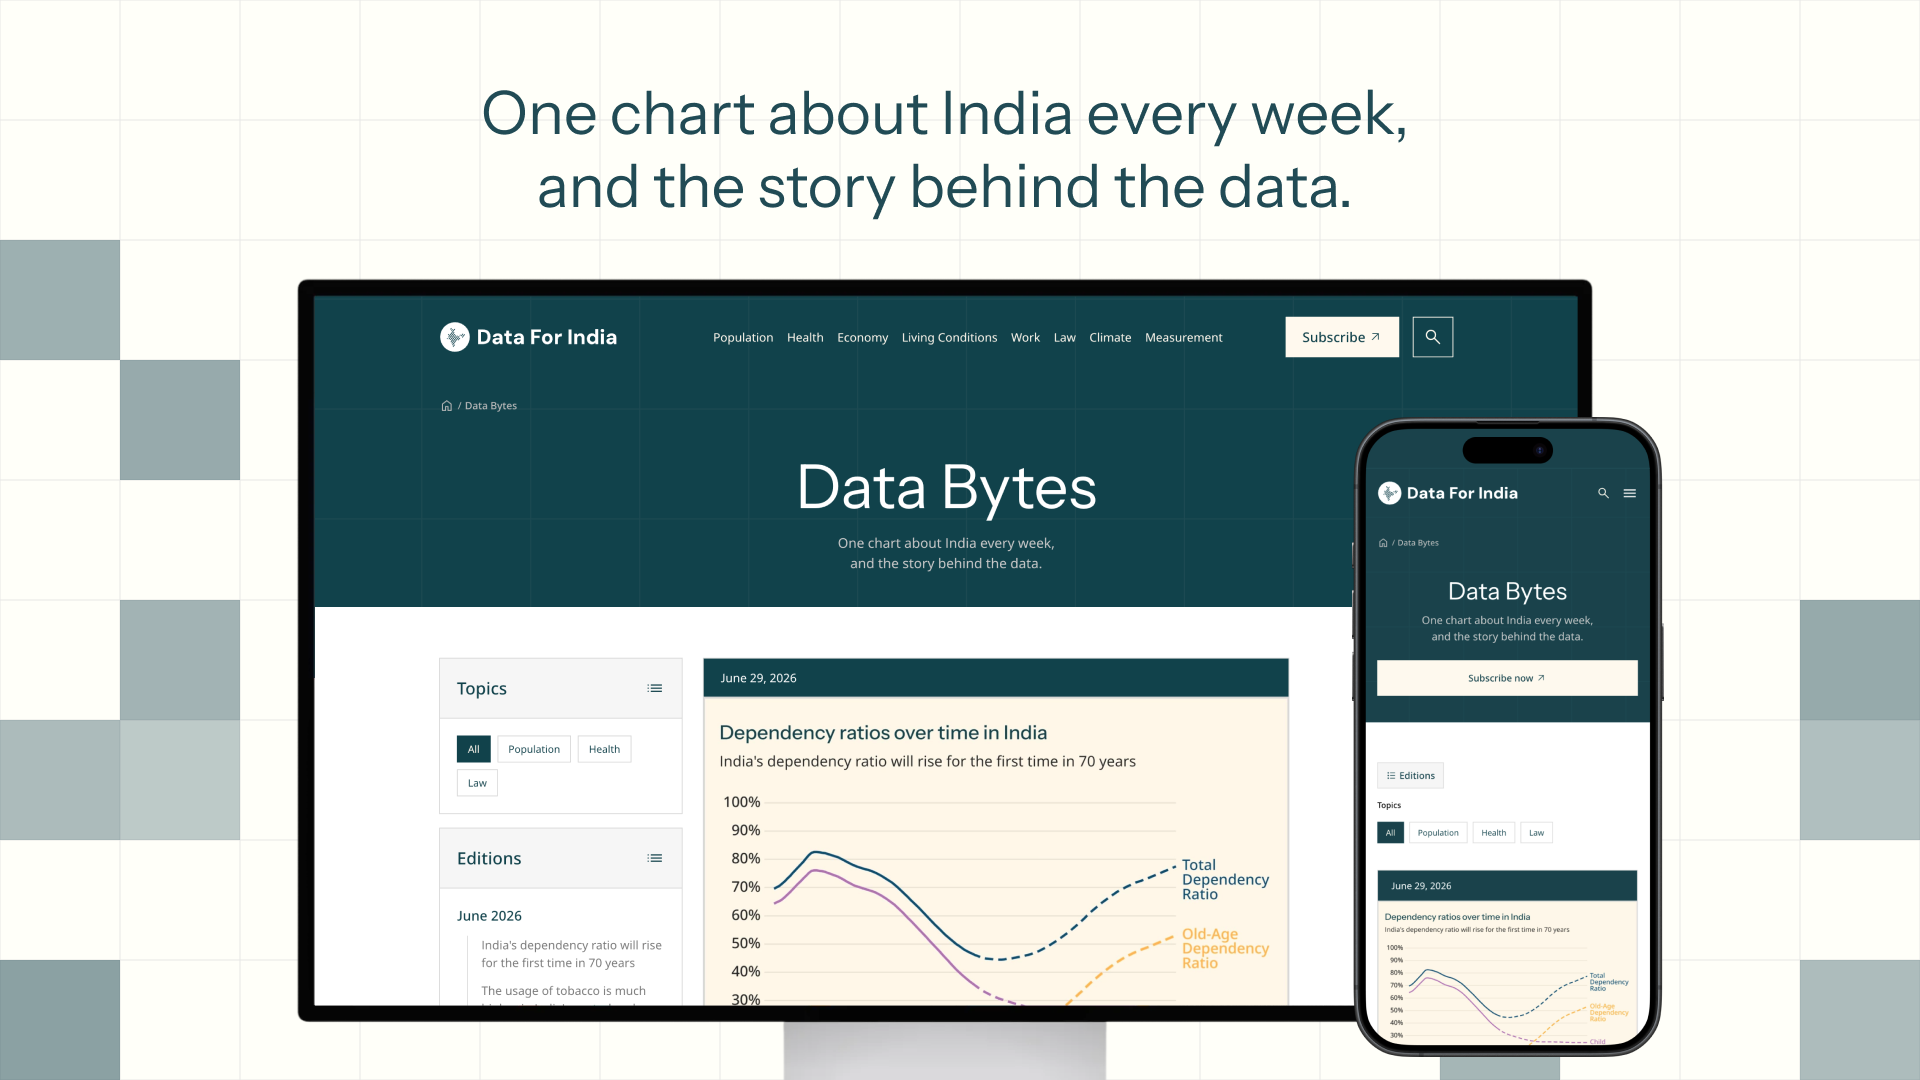
We built Data For India to expand everyone’s understanding of India through the data. We take public data and make it usable, derive descriptions and insights about the country from it, visualise these insights through charts, and make all of it freely available - the insights, the charts and the underlying data.
We launch with five key socio-economic verticals - Population, Health, Living Conditions, Work and Economy - as well as a Measurement vertical which seeks to explain and demystify data concepts and methodologies. Over time, we will be expanding to more verticals.
We look forward to your engagement with Data For India, and hope it brings insight and clarity about India.