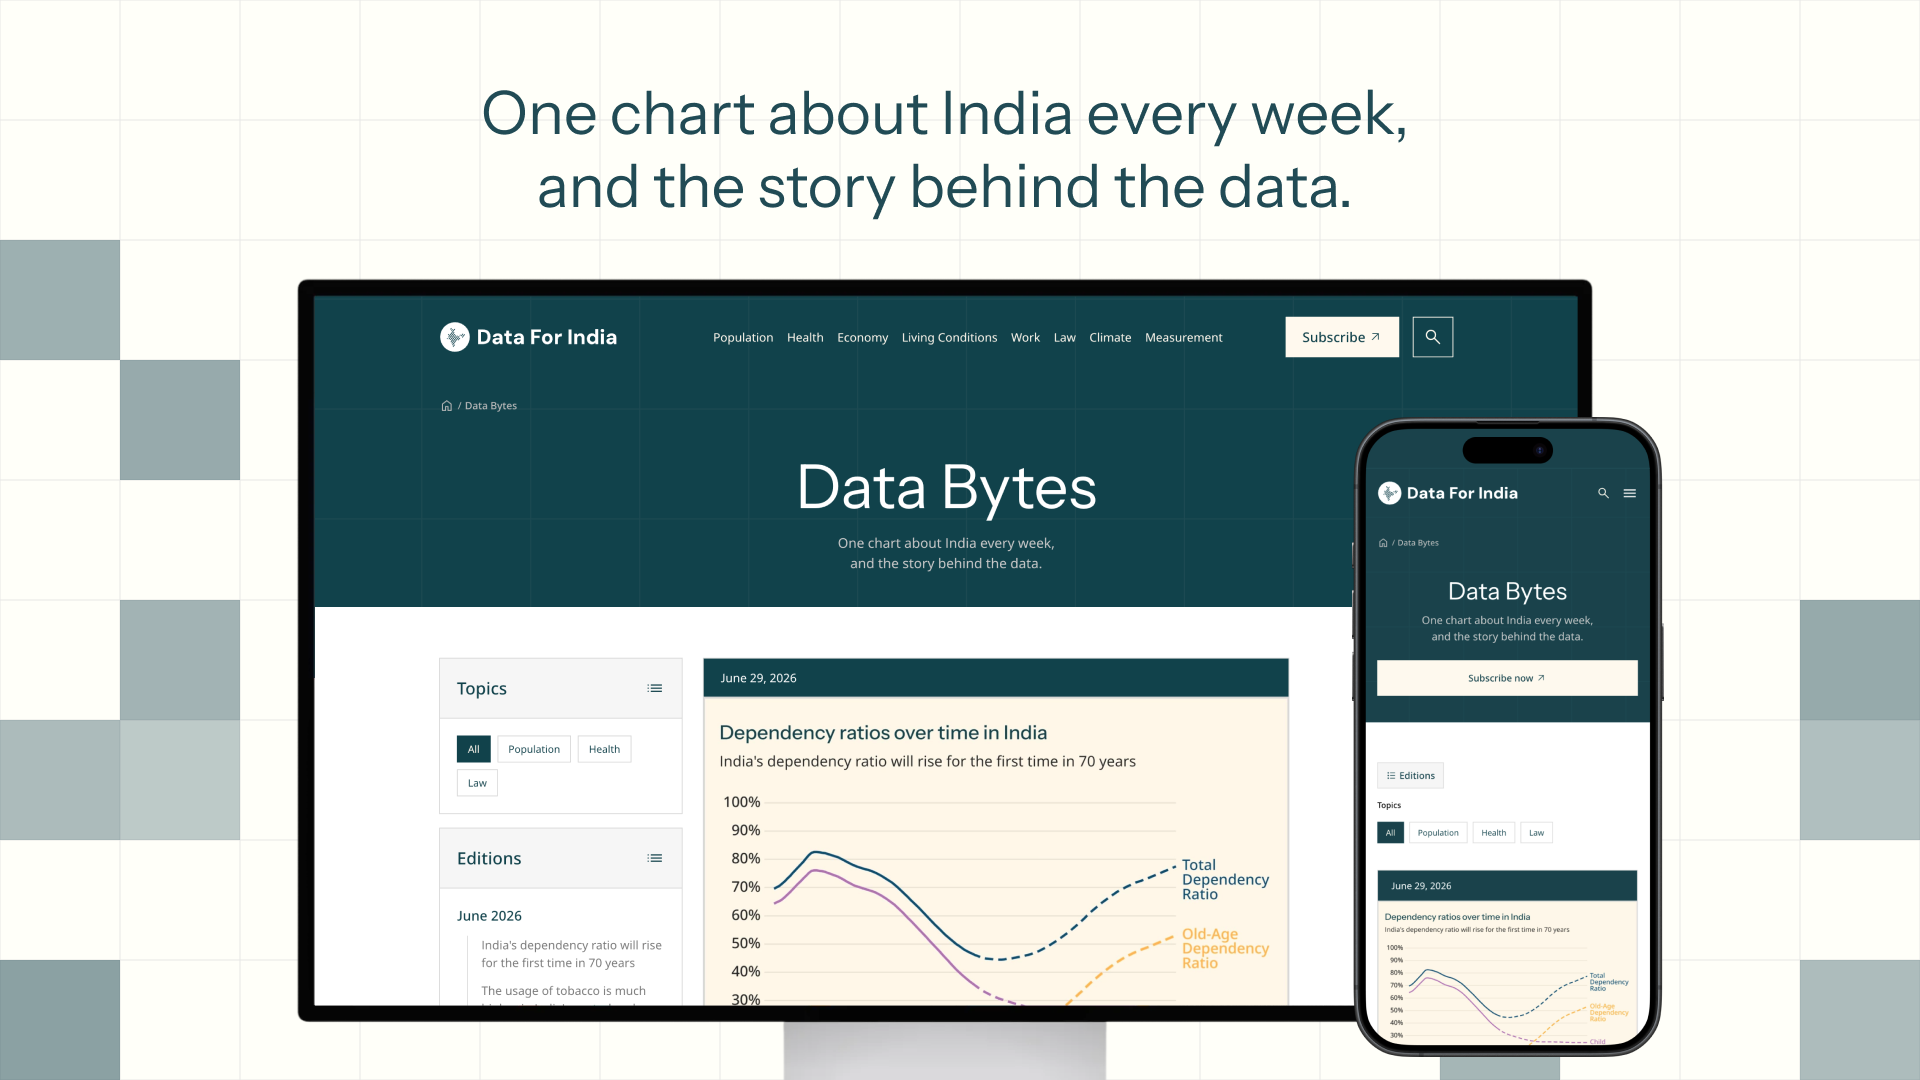
Introducing Data Bytes: One chart about India every week
Our new weekly format brings Data For India’s research depth to smaller, sharper questions about India, one chart at a time.

Search across articles, charts, datasets
Highlights from our research, insights and updates
Data For India is a public platform that turns complex government and institutional data into clear, research-backed insights
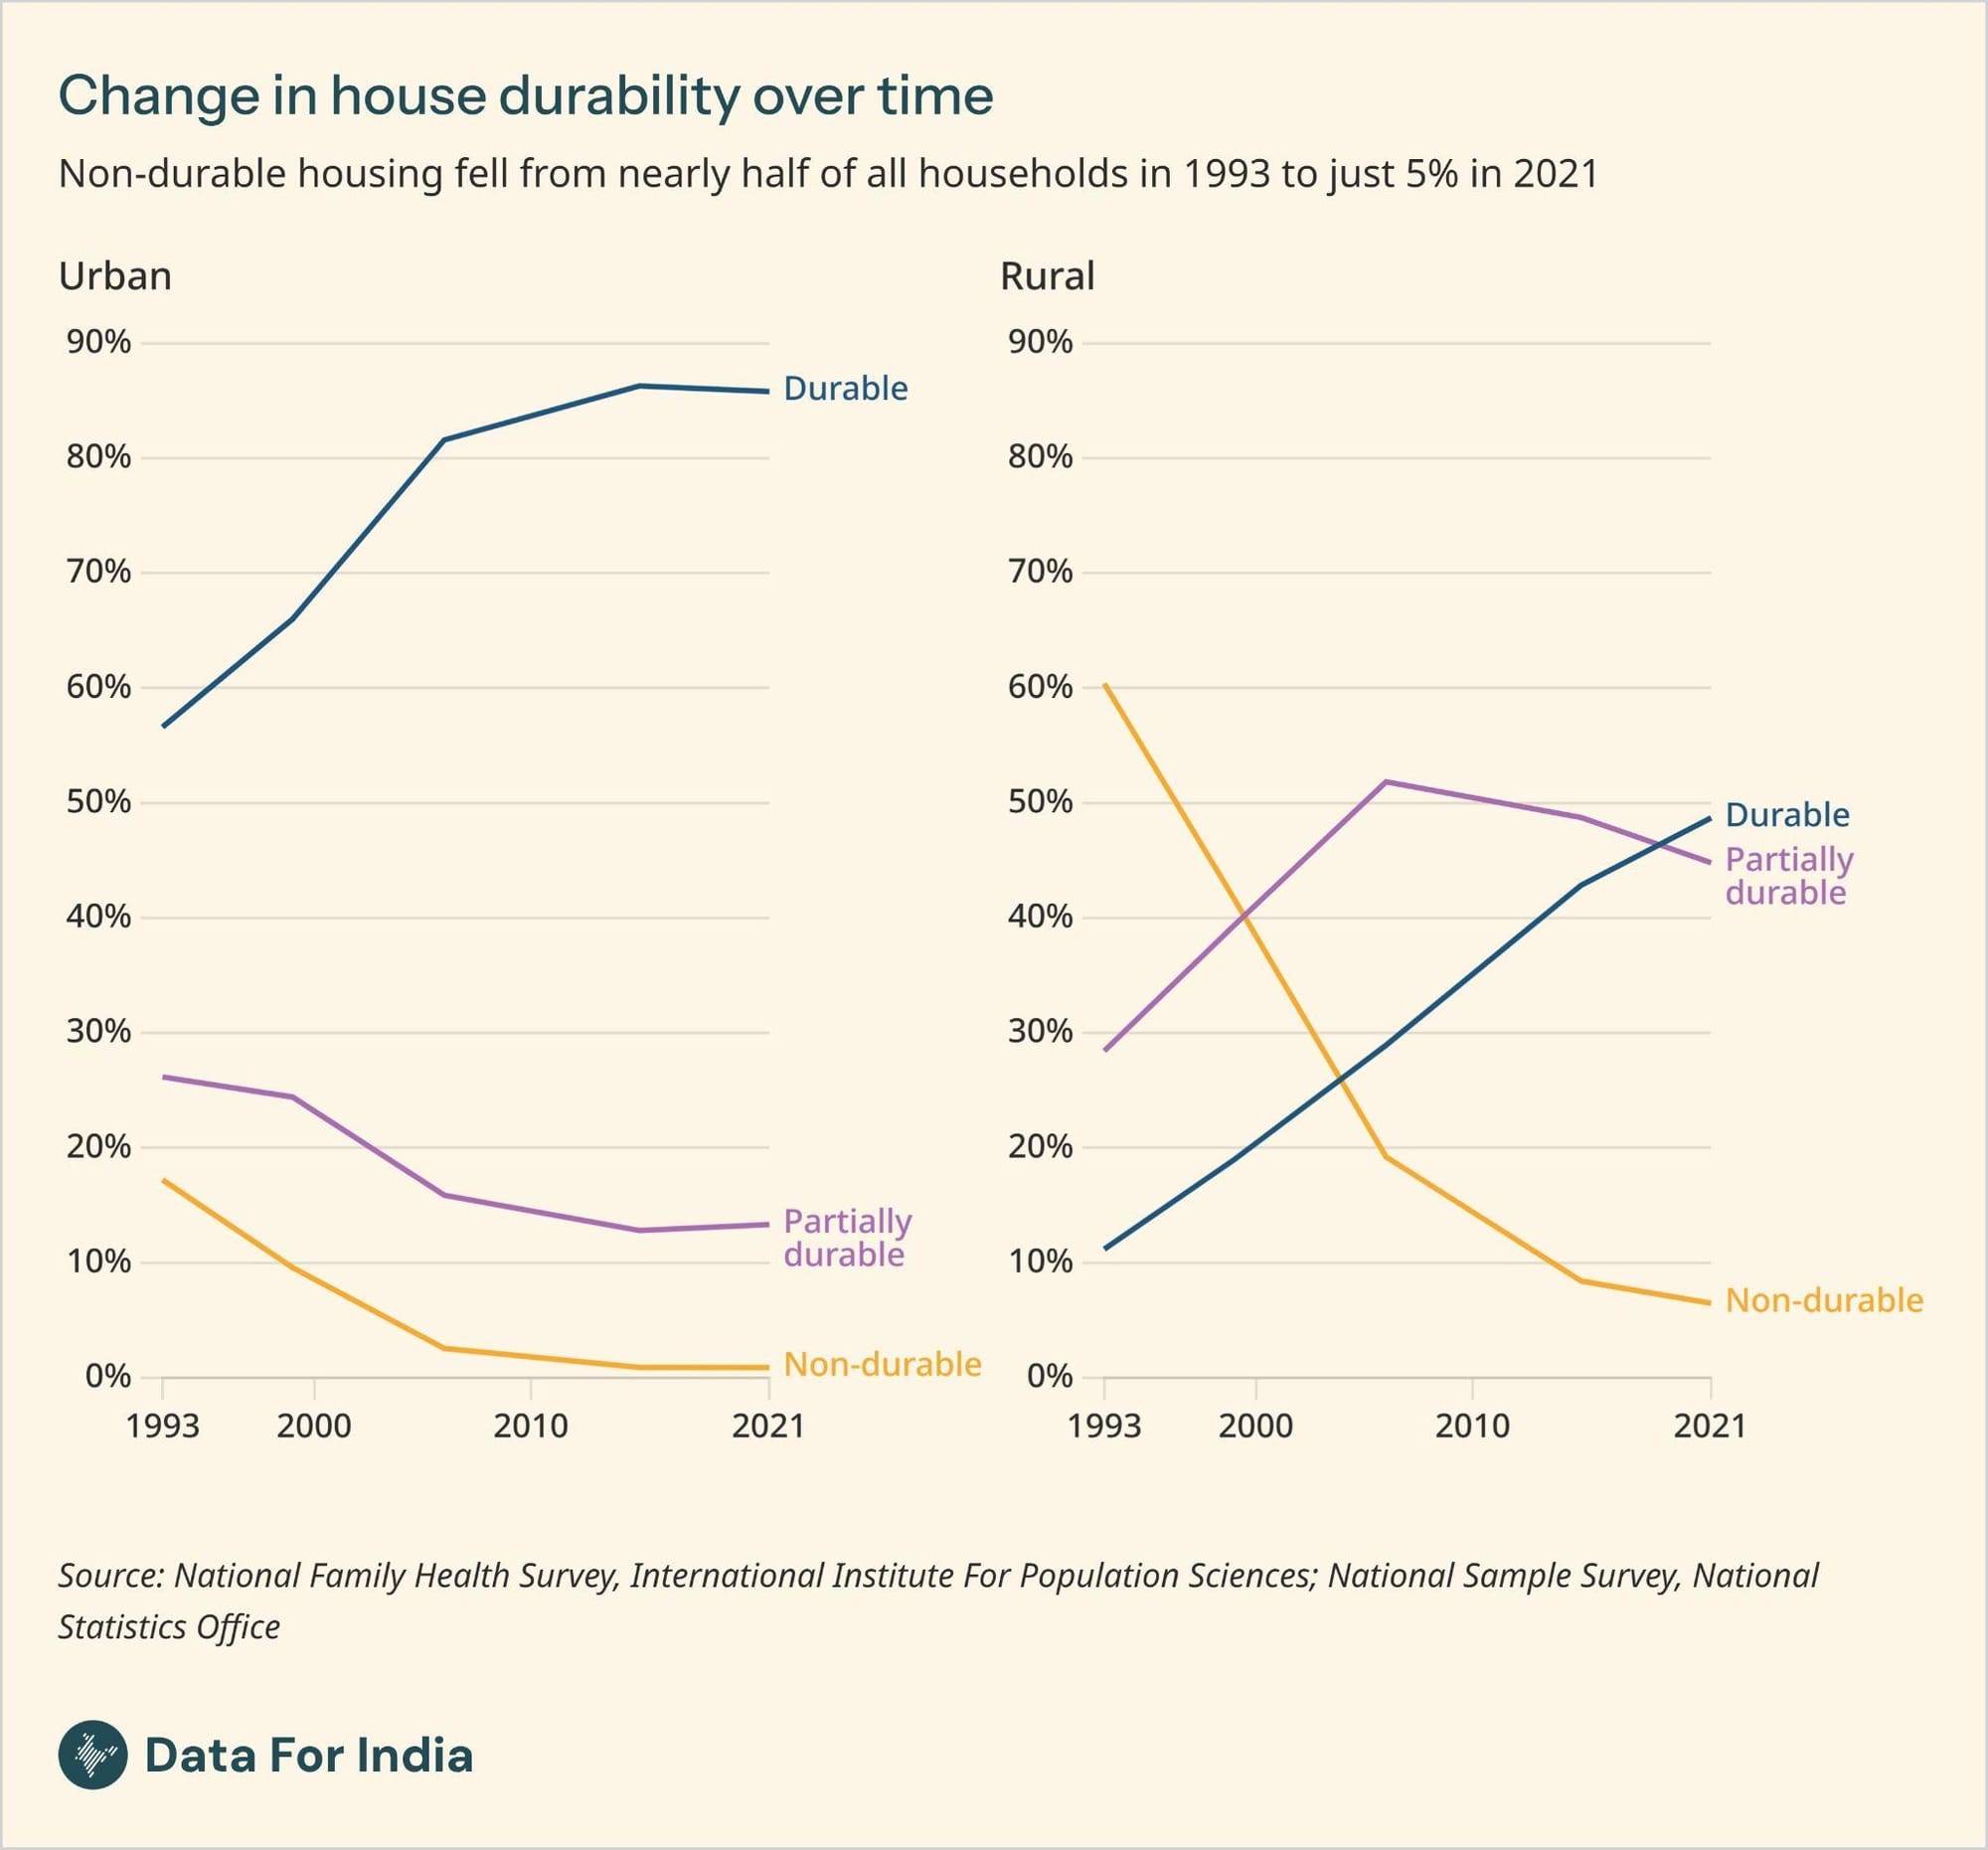
One chart about India every week, and the story behind the data.
How India’s demographics are changing, with falling fertility and slowing population growth, and what the future holds.
What makes Indians sick, what makes them better, and the historic transformations in Indian health.

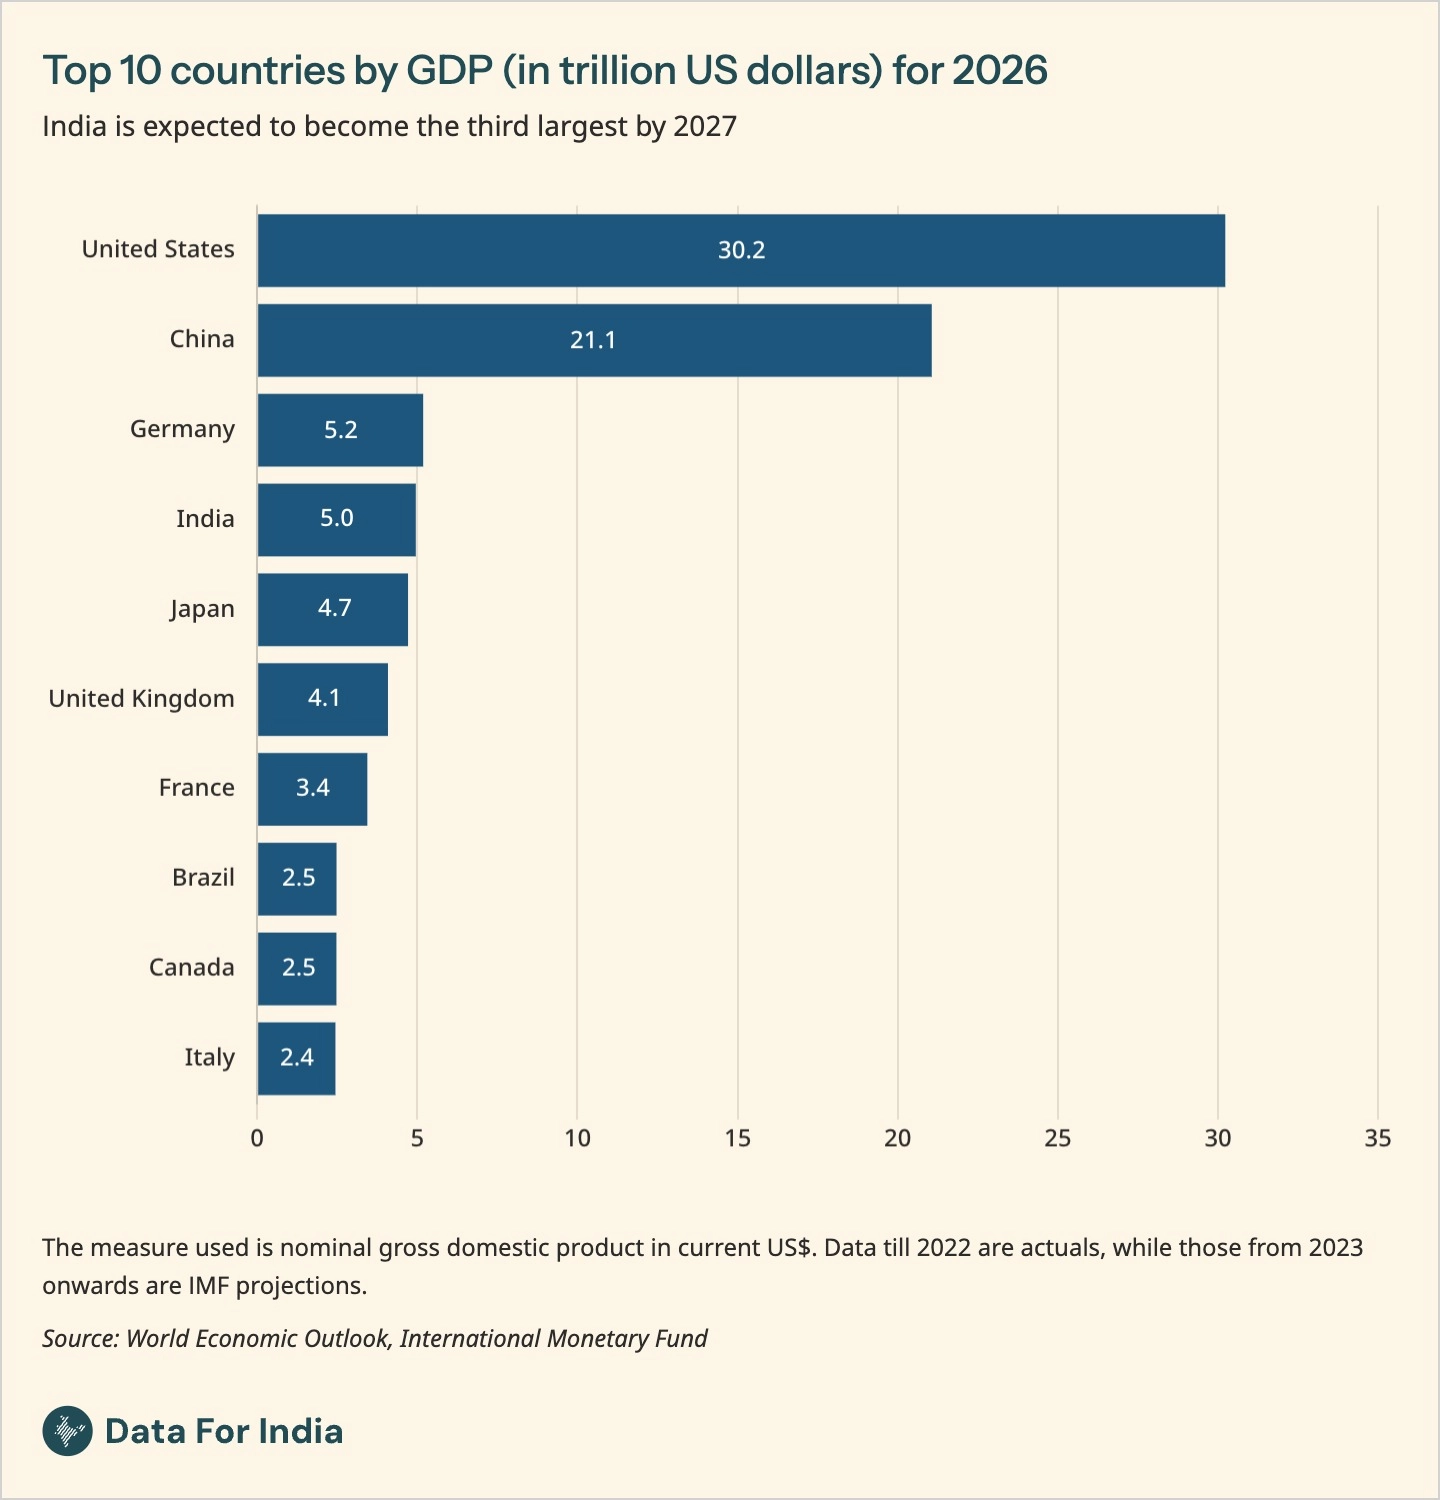
The sectors that make up the Indian economy, how they compare with other countries, and how they have changed over time.
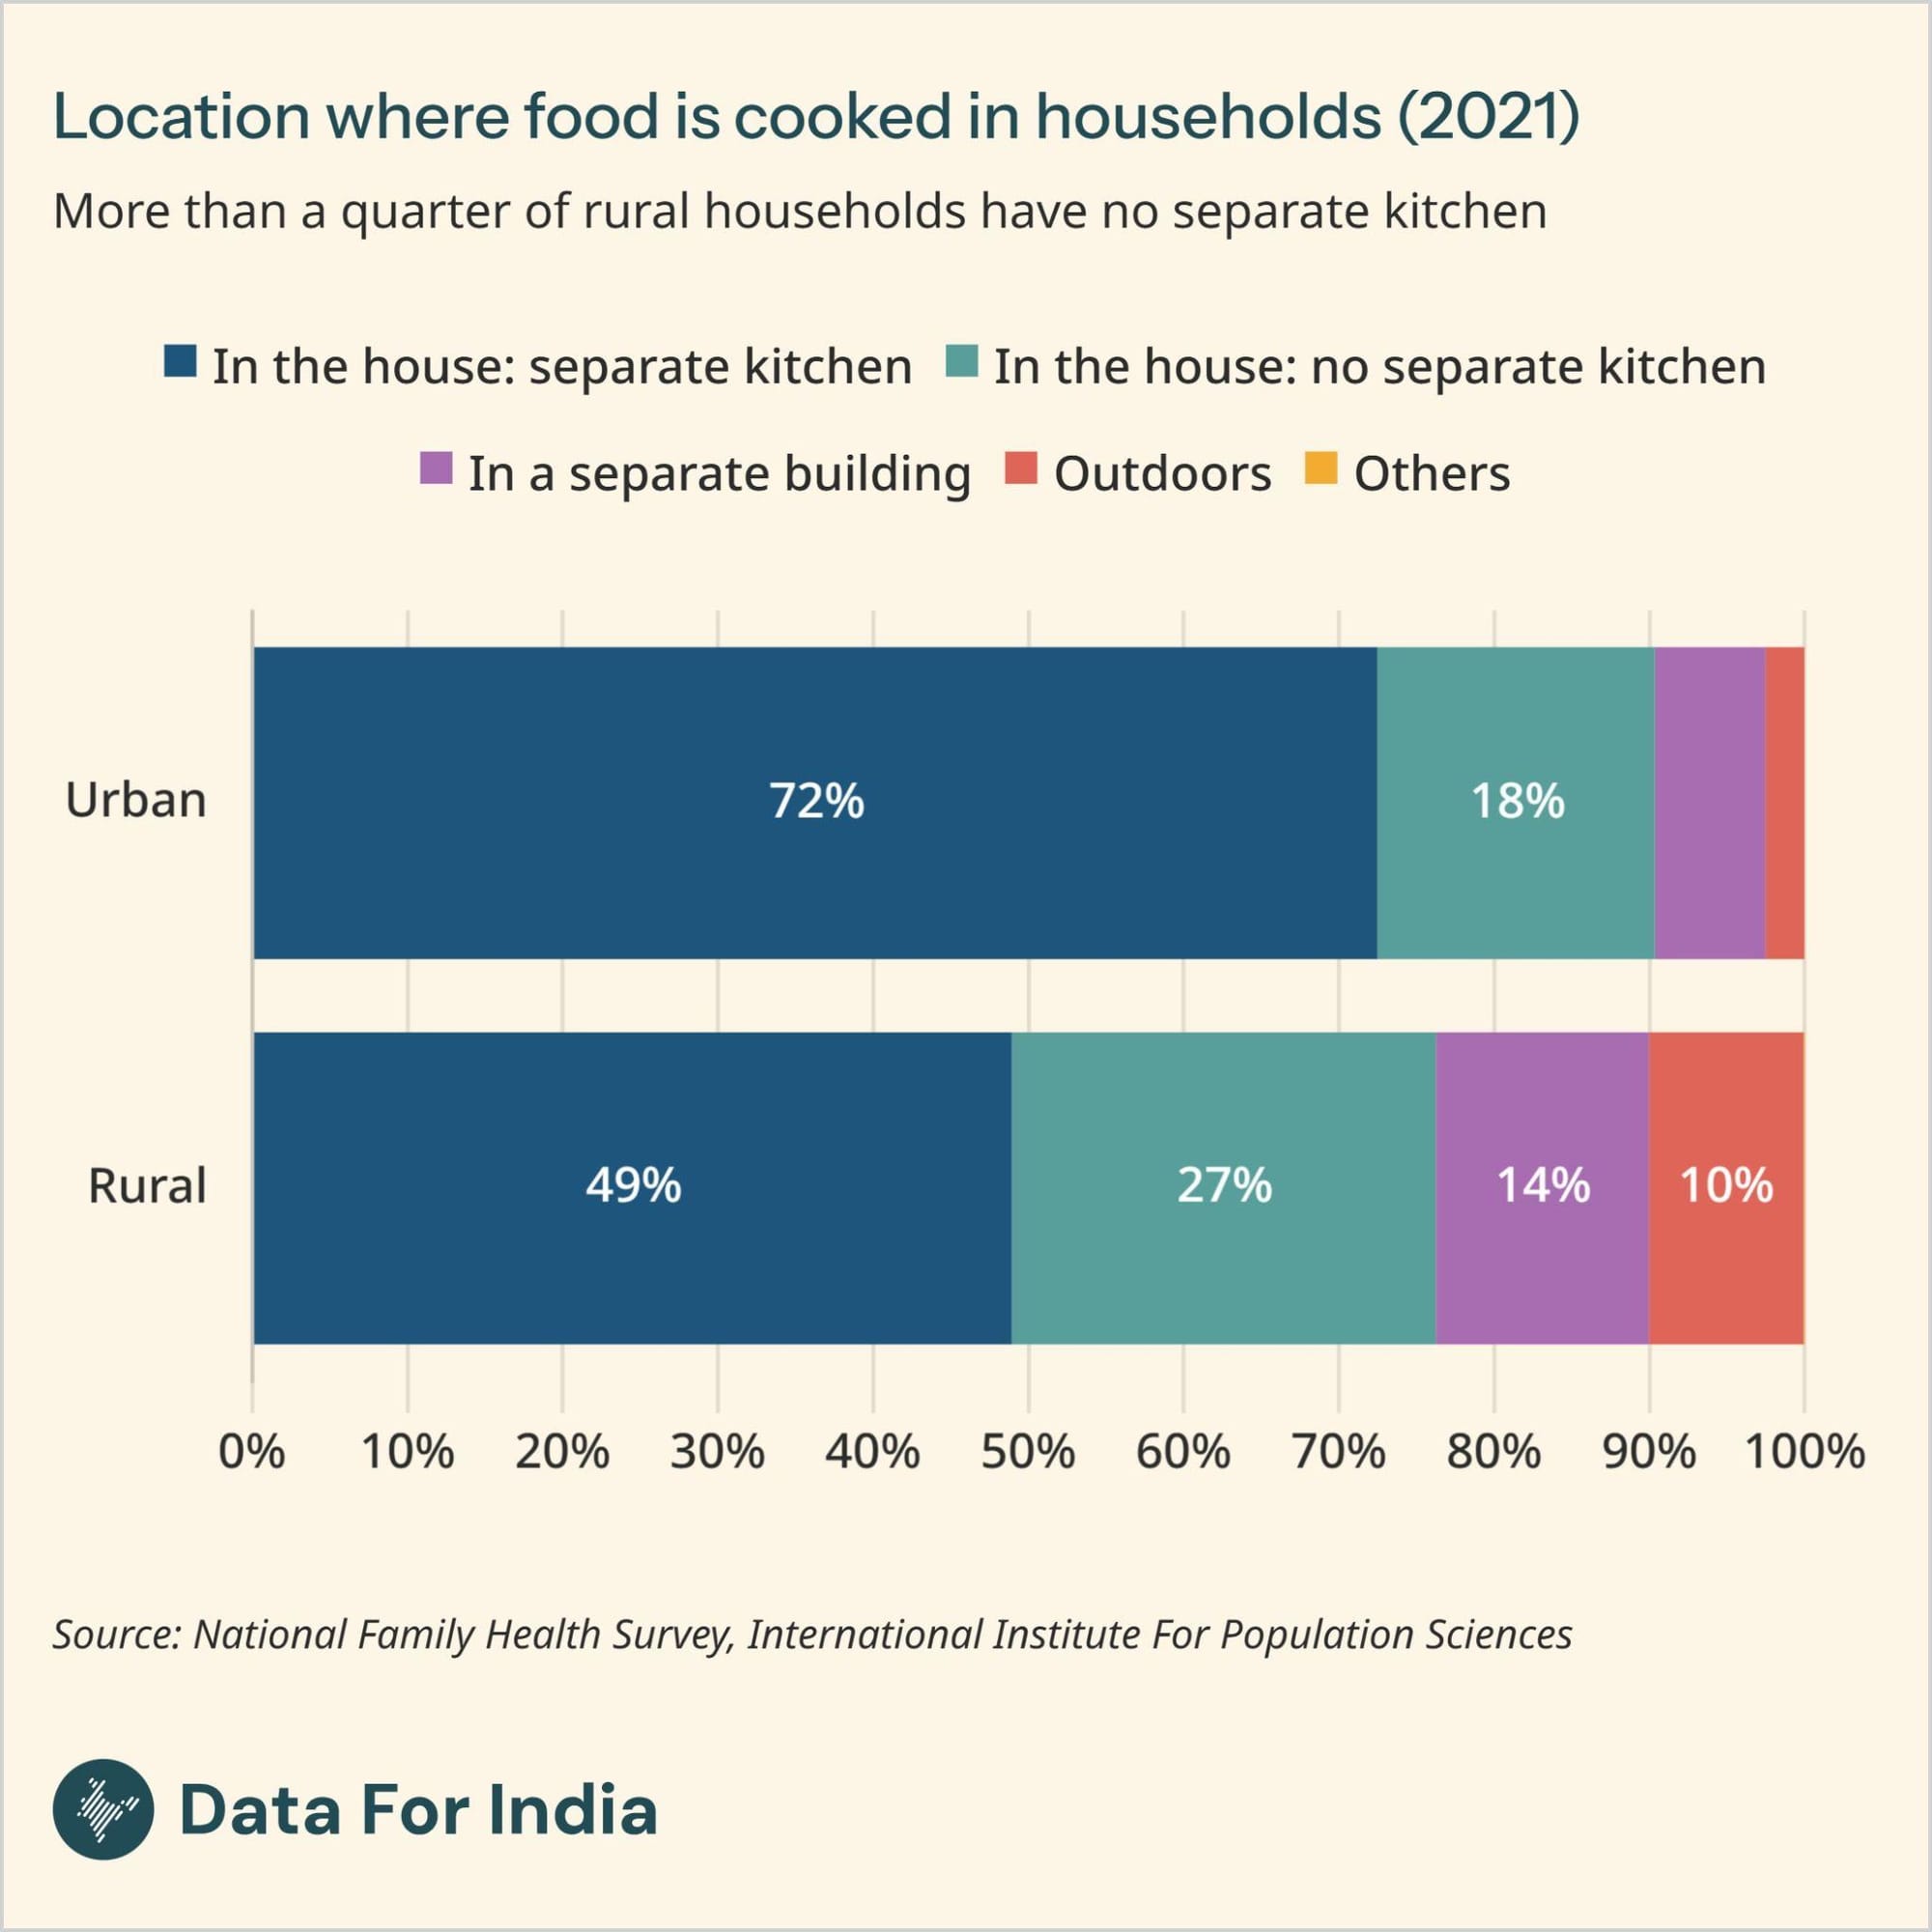
Access to household assets and amenities across India, differences between groups and how it is changing.
The transformations in India’s workforce, including women's participation, the nature of work, youth unemployment, and job growth.

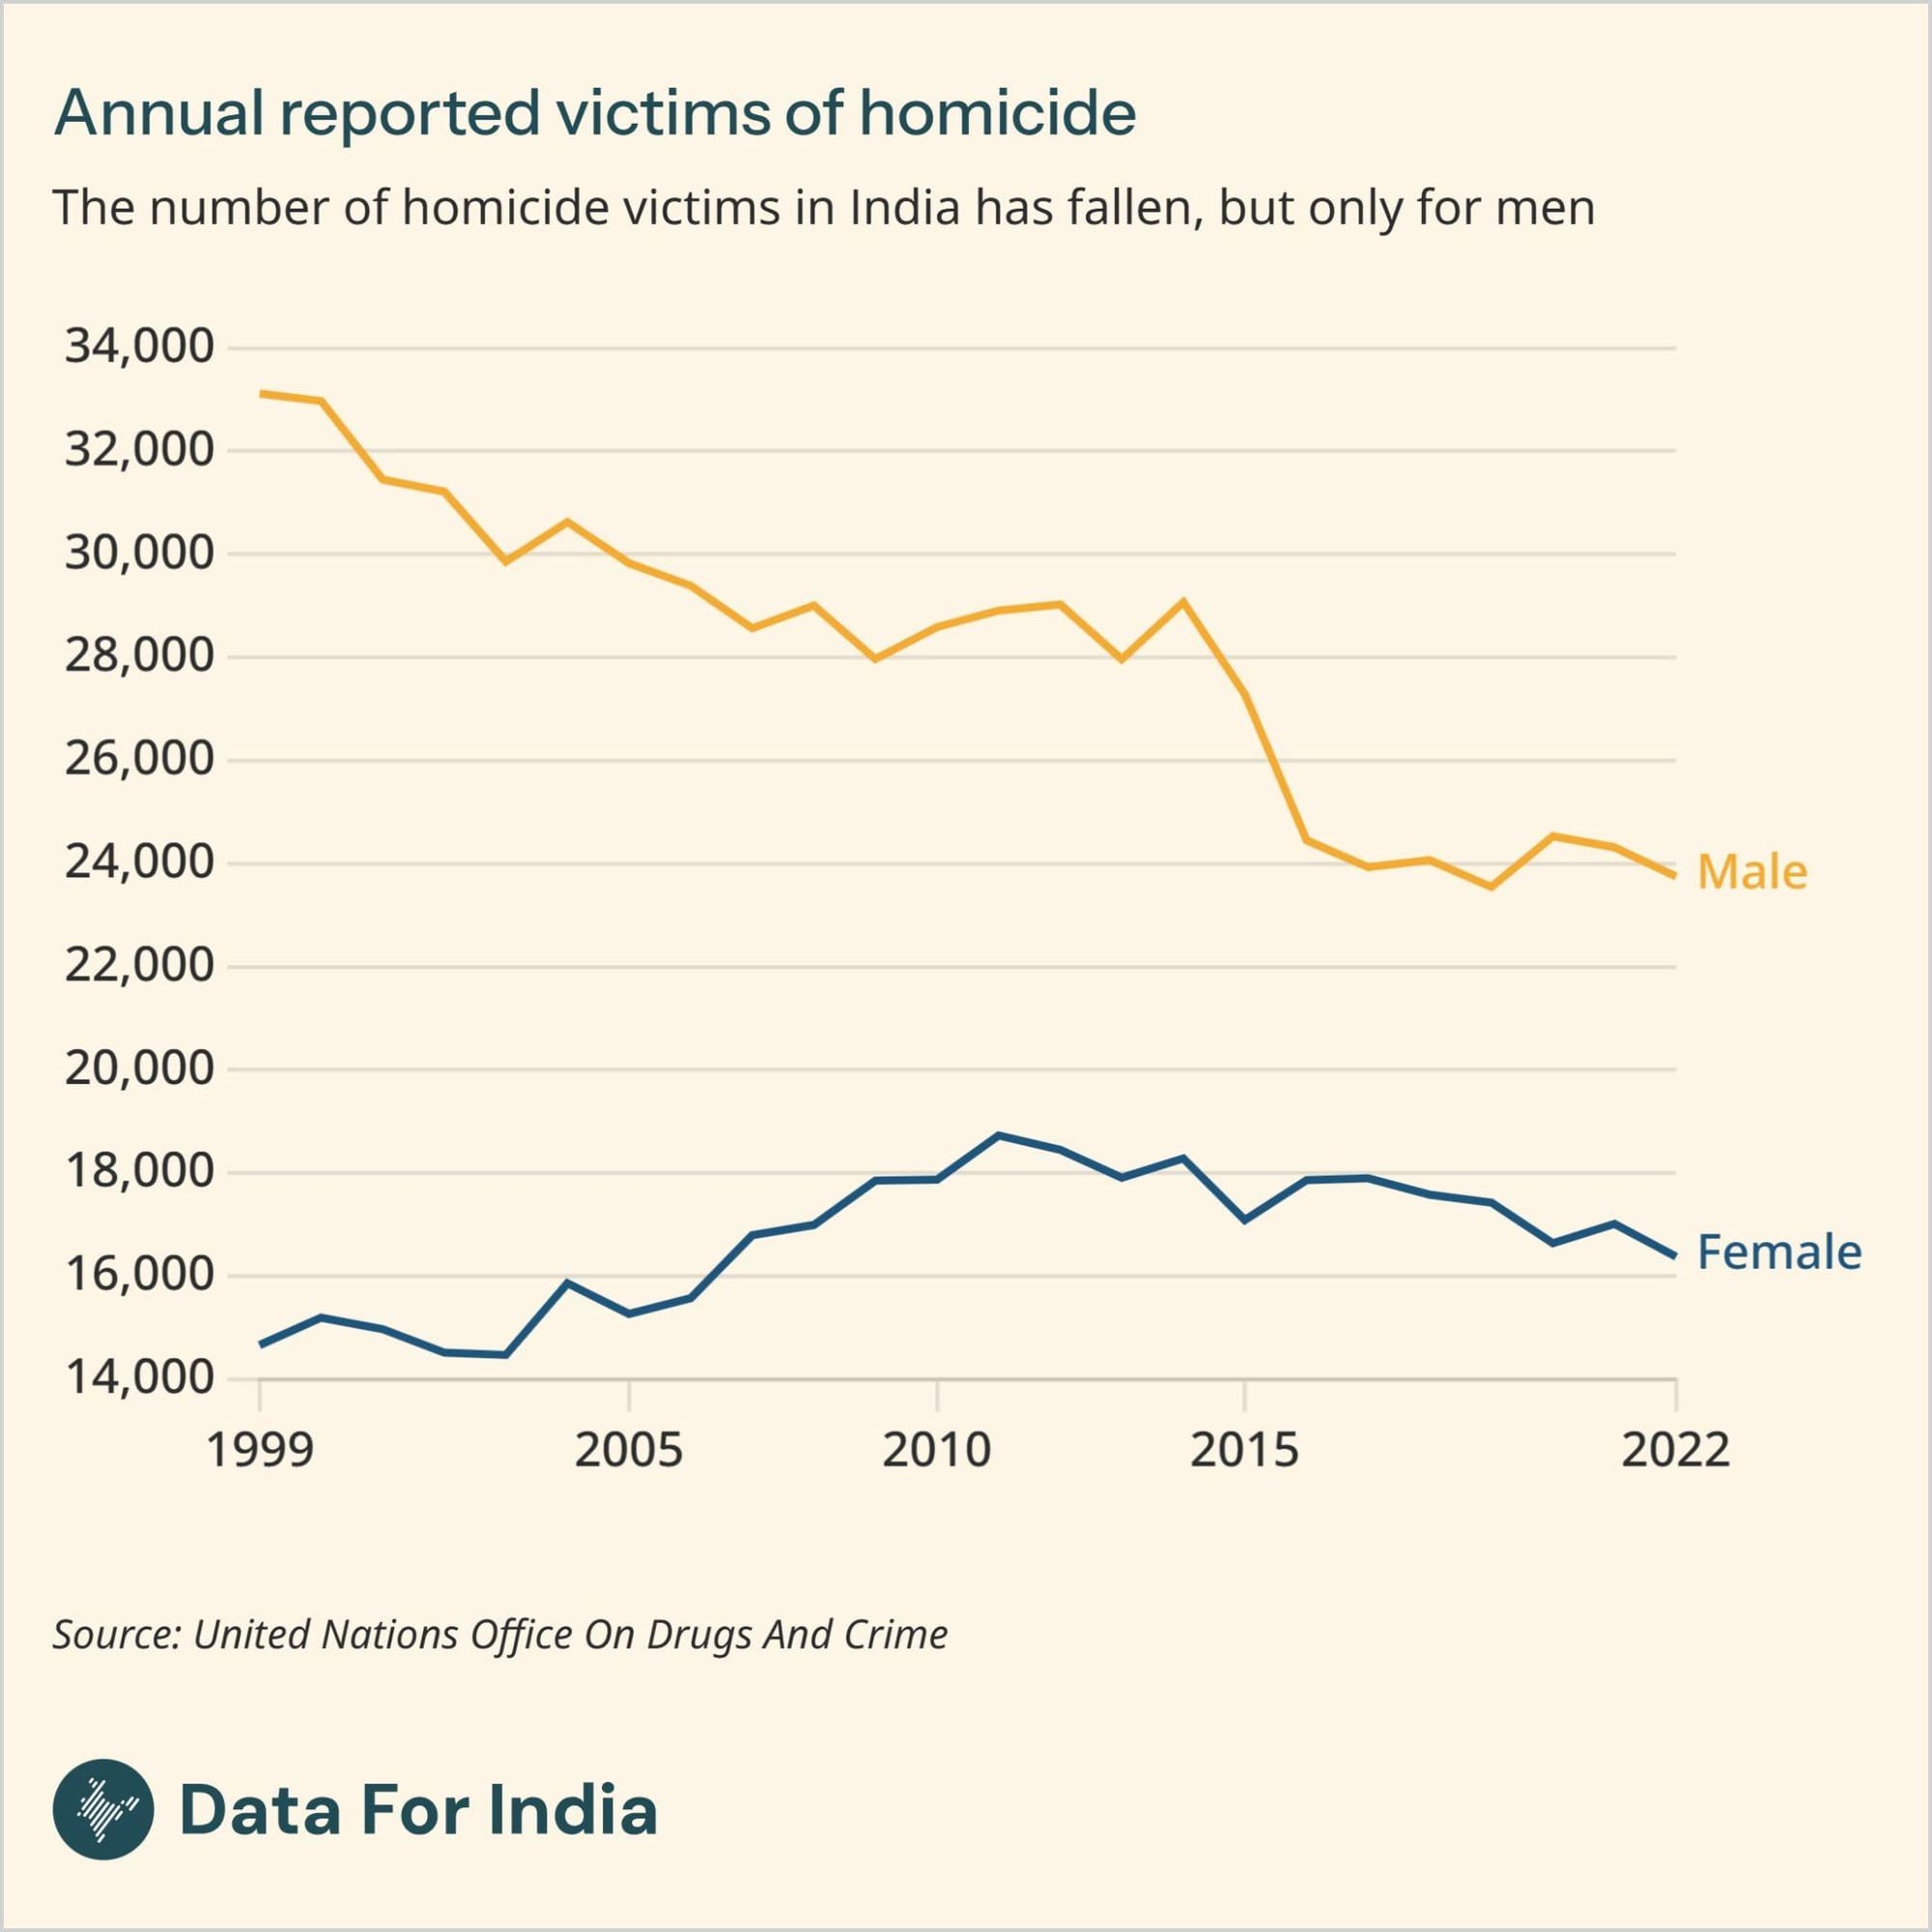
How Indians experience violations of the law, and access ways to get justice, including the workings of the police, prisons and courts.
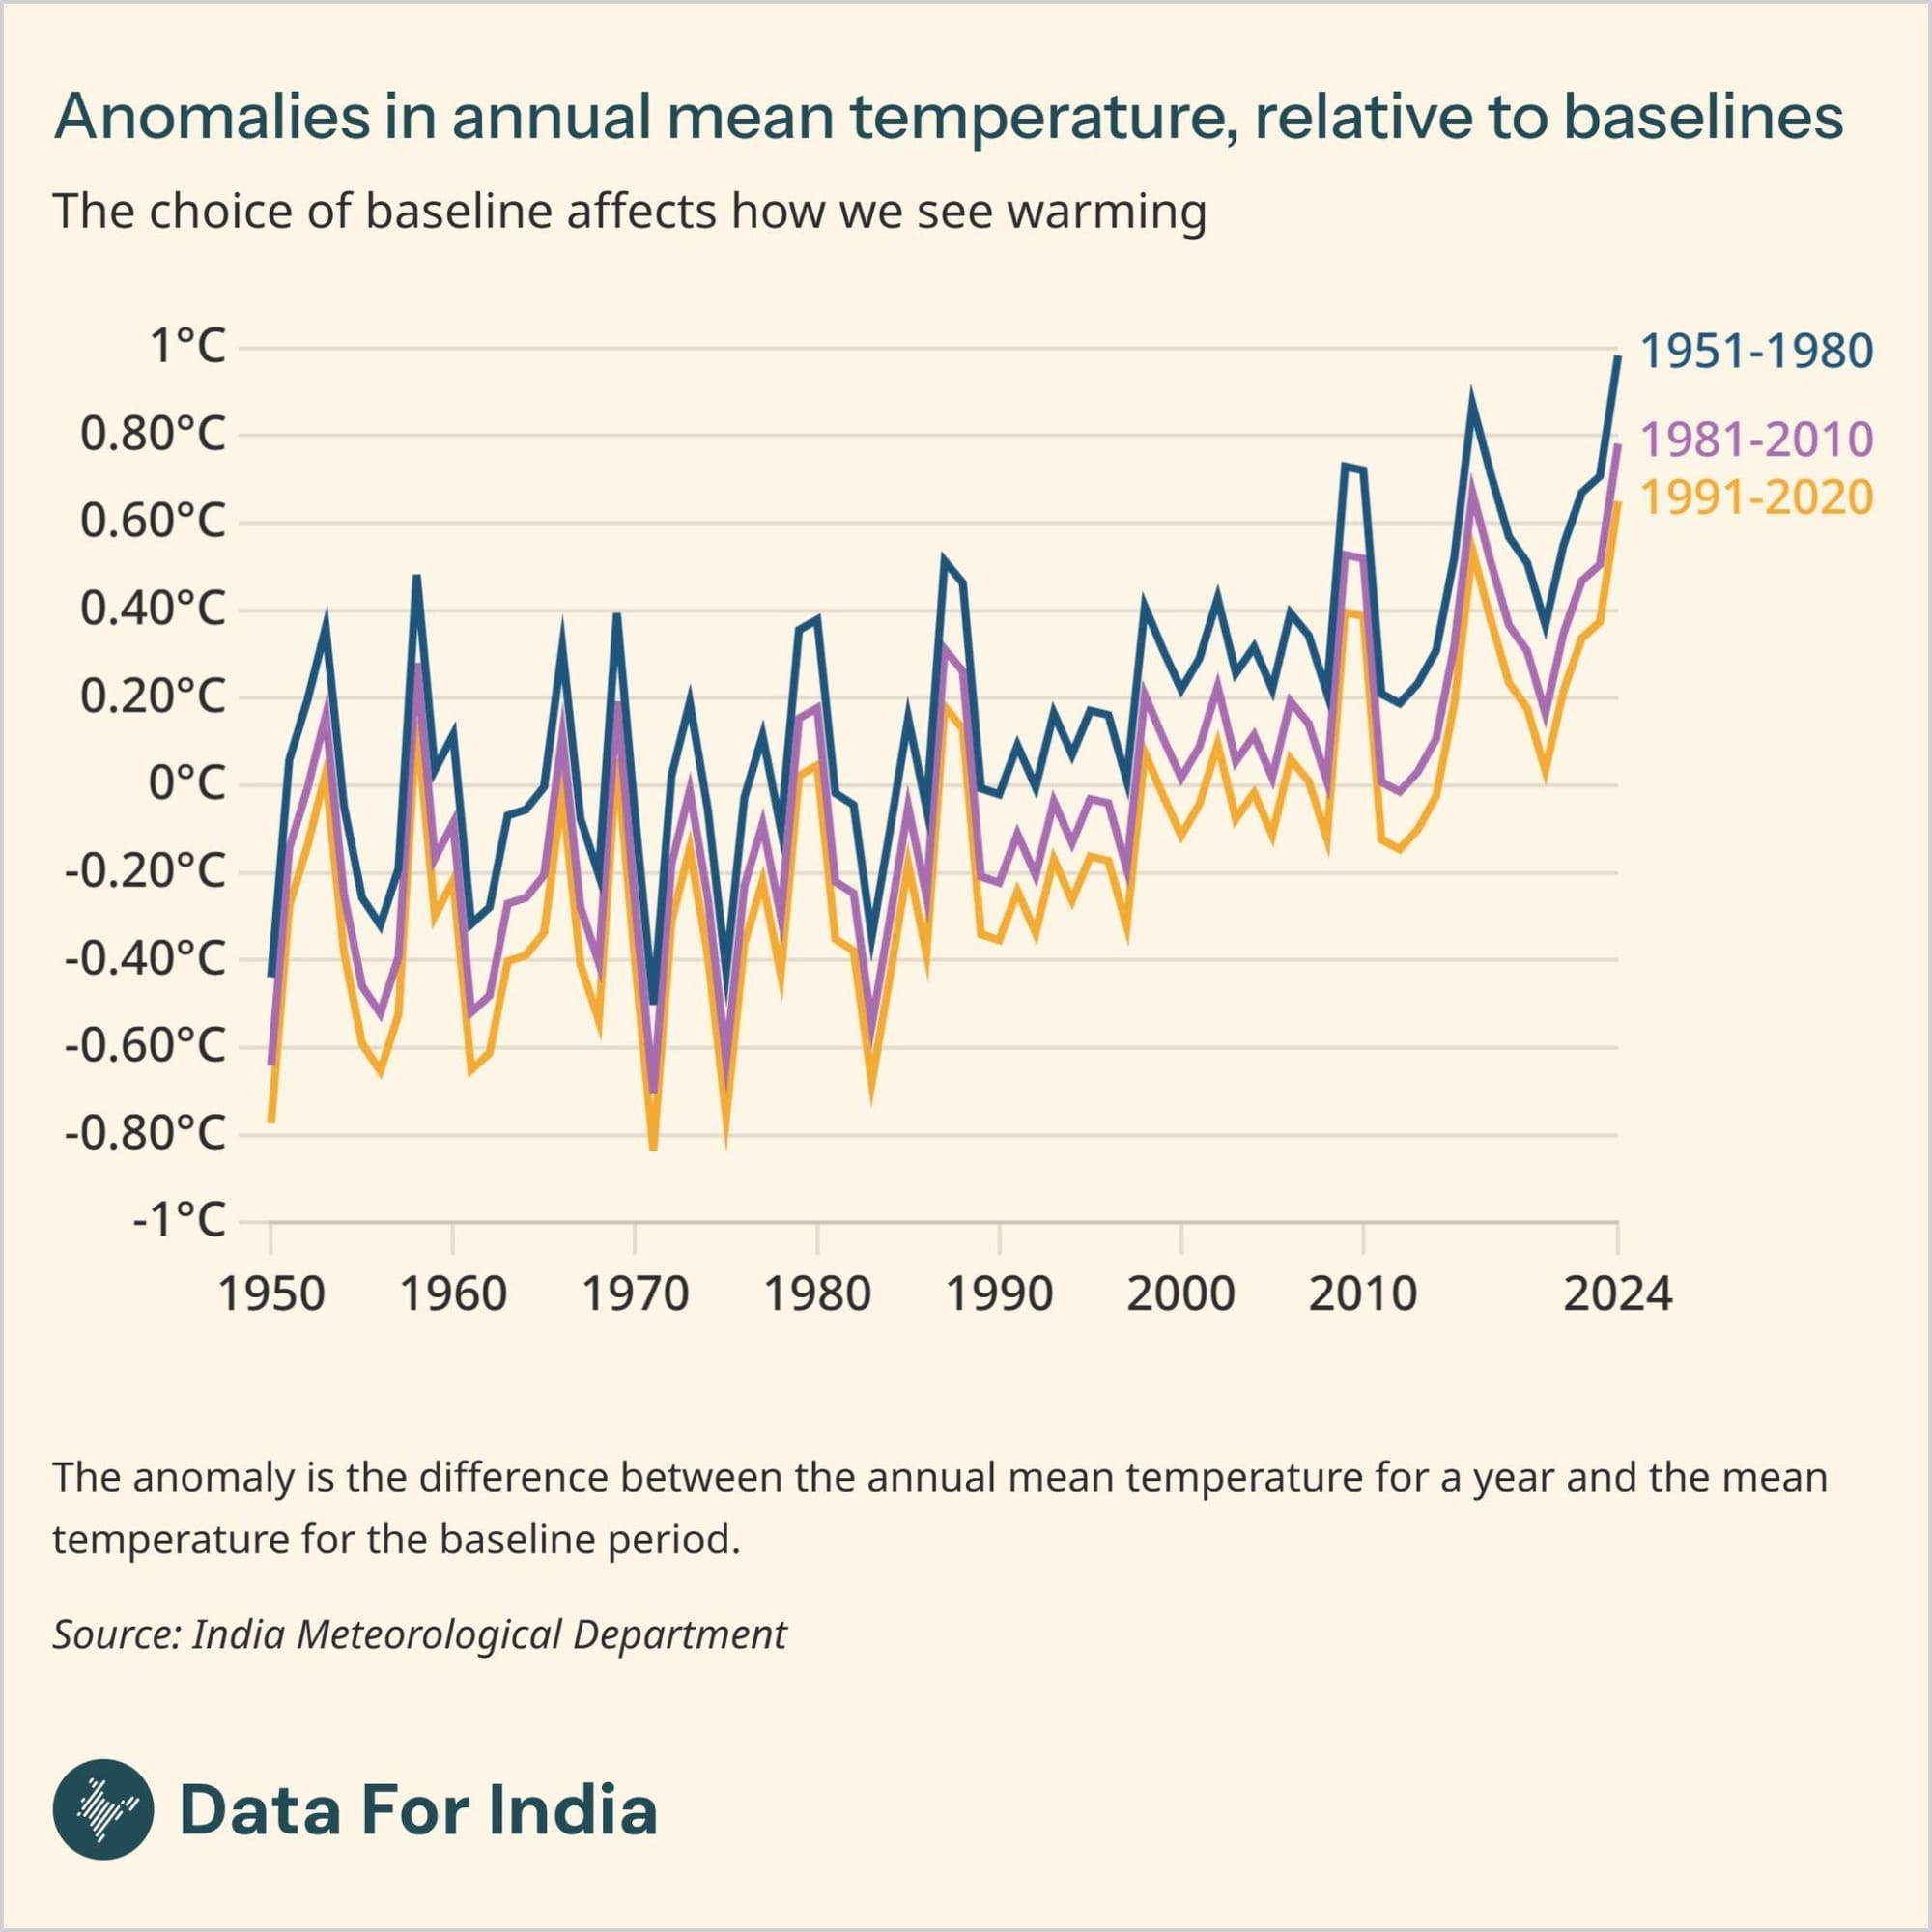
Changes in climatic conditions, tracking emissions, the energy transition, and transformations in agriculture and food security.
How the data we use is collected, what the definitions of official statistics really mean, and the methodology, including its flaws.
Our full range of articles organised by topic