India’s factories
India's 200,000 factories employ 18.5 million workers and are significant contributors to the economy. We look at where they are, what they produce and whom them employ.
Manufacturing is an important component of India's economy, accounting for 15%[1] of the gross value added[2] and 10% of jobs in India.[3]
Organised manufacturing activities carried out mainly in factories add 90% of the economic value created by manufacturing.[4]
What is a factory?
India's Factories Act (1948) defines a factory in two ways. A factory could be any premises where ten or more workers were working on any day of the preceding twelve months and where a manufacturing process that uses power was being carried out. Or, a factory could be any premises with 20 or more workers on any day of the preceding twelve months where a manufacturing process without using power was being carried out.[5] However Indian states can also amend the definition of a factory. As of 2024, at least 14 states had raised the worker threshold to 20 or more workers with the use of power, and 40 or more workers without power.
The Annual Survey of Industries, conducted by India's National Statistics Office since 1960, is the most exhaustive source of data on India's factories, and covers factories as defined by the Factories Act. Apart from manufacturing units, this also includes some establishments involved in agriculture, utilities and services which make up less than 10% of the factories covered by the ASI.[6]
The ASI surveys factories from across the country.[7] The selected factories submit data on the number of units they operate, ownership details, industry of work, employment, expenditure on inputs, value of outputs, fixed assets, depreciation and capital formation, every financial year.
Factories in India
India had about 250,000 factories in 2023.[8] However, this included units that were deregistered, or those which were closed at the time of survey.[9]
Operational factories, on the other hand, discount deleted, deregistered and closed units.[10] The ASI finds that India had a little more than 200,000 operational factories as of 2023.
India's operational factories created nearly Rs 22 trillion in value added as of 2023.[11] Factories in three sectors - basic metals, chemicals and their products, and petroleum products - created one-third of this value added.[12]
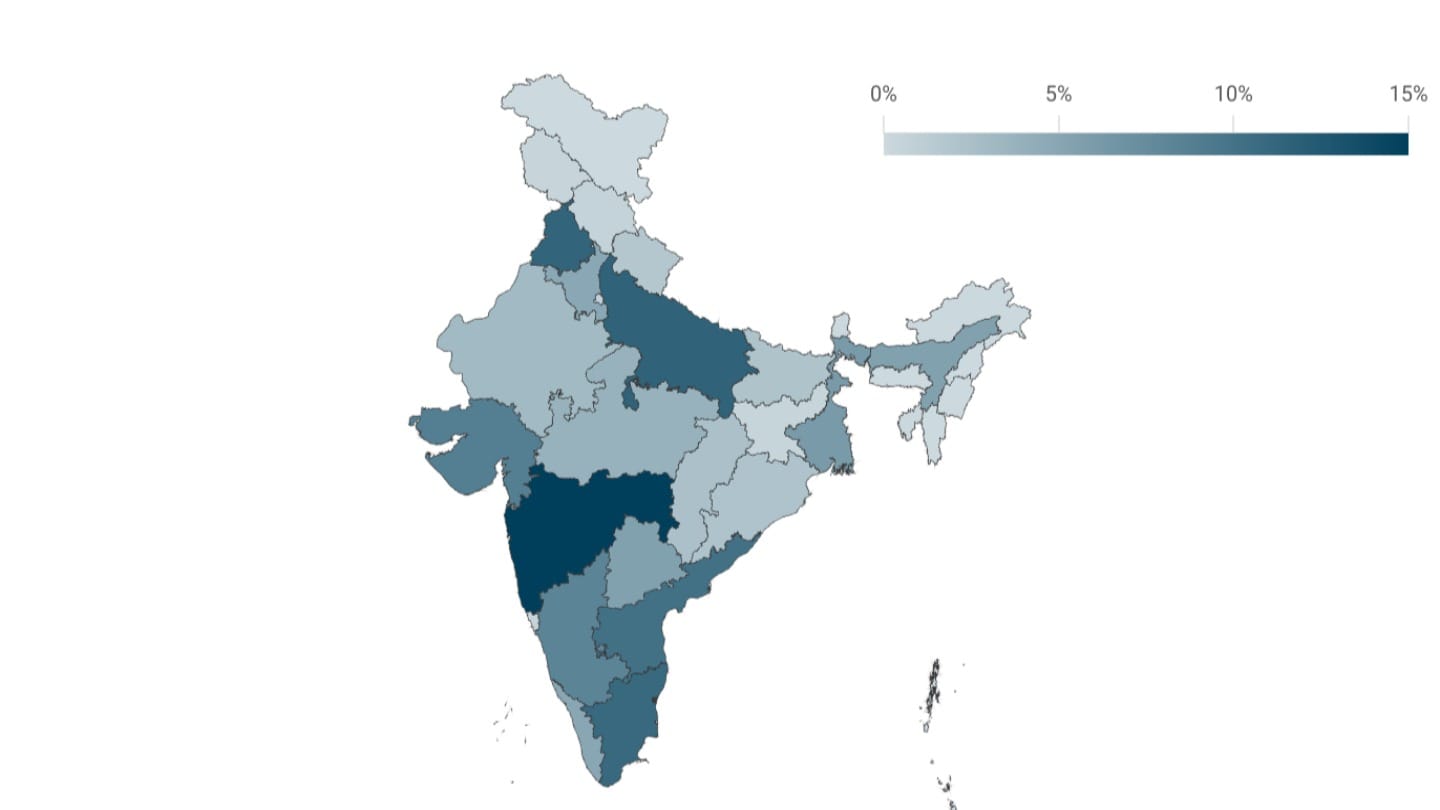
Factories are unevenly distributed across the geography of the country. Half of India's factories are concentrated in just five states - Tamil Nadu, Gujarat, Maharashtra, Uttar Pradesh and Karnataka. Tamil Nadu has the most factories, accounting for more than 15% of India's operational factories.
What do India's factories produce?
The top products manufactured by India's factories are fuels such as diesel, petrol and airline fuel, automobiles and automobile parts, construction materials like cement and bitumen, and raw steel products.[13] The top ten products manufactured by these factories in terms of value account for more than a fifth of India's factory output.
Factory employment
The 200,000+ operational factories of India employed 18.5 million people as of 2023.[14] This represents about 30% of the manufacturing workforce, and 3% of India's workforce as a whole.[15]
Most factories in India do not hire a large number of workers. Nearly half of India's factories employed less than 20 people.
However, over time, factories are growing in size; in 2001, only one in ten factories employed more than 100 workers, but by 2023, one in five factories employed 100 or more workers.
Workers and managers
Workers are defined as the employees in a factory who are directly involved with the manufacturing process, and may be directly employed by the factory, or indirectly through contractors. Managers and supervisors oversee the manufacturing process and workers. Other employees include those involved in administrative, technical and clerical functions. They could also include unpaid workers, who could be working proprietors or unpaid family members.[16]
Of the 18.5 million factory employees, a little under half are directly employed workers, while six million workers are employed through contractors.
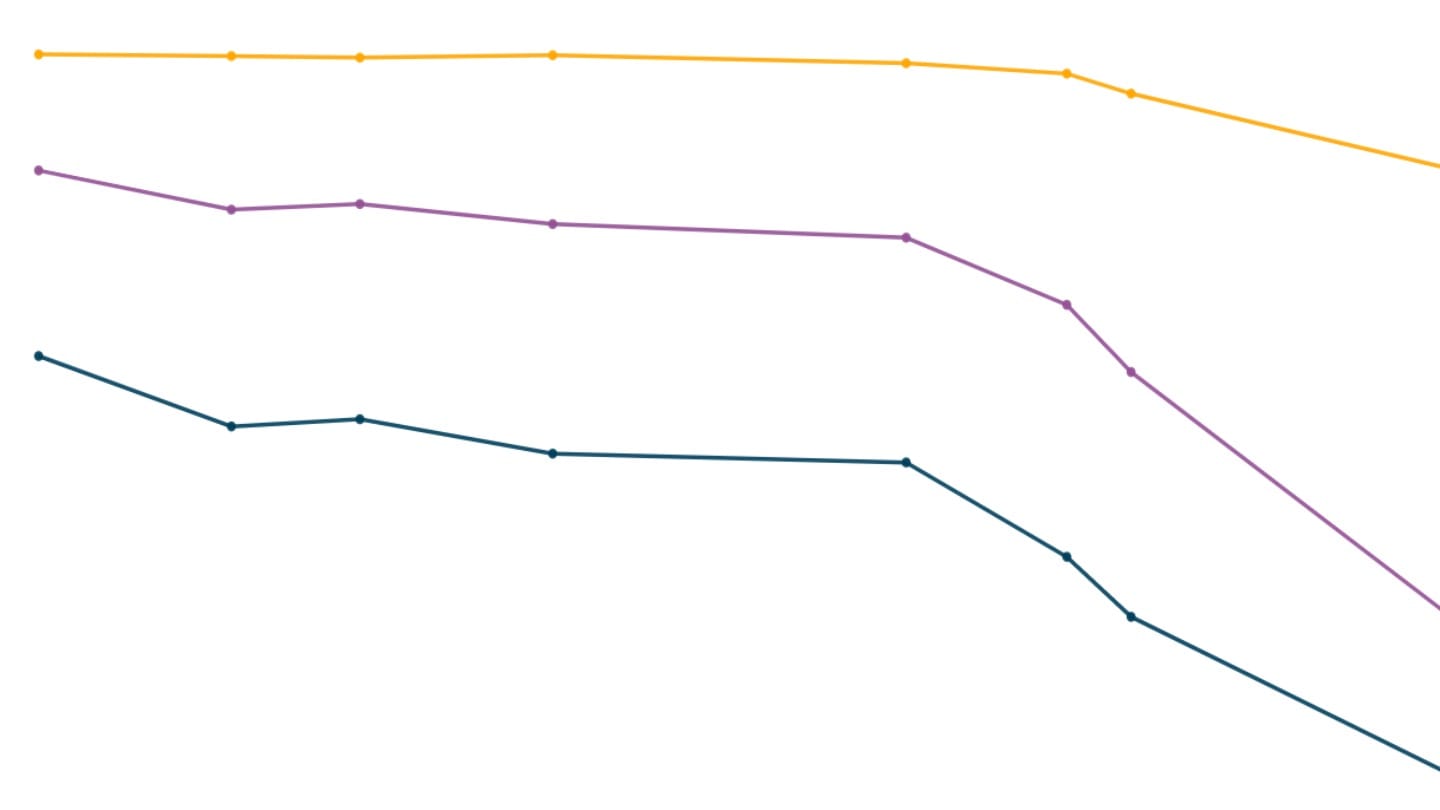
Factory employment has more than doubled over the last two decades, going from eight million in 2001 to nearly 19 million factory employees in 2023. The fastest growth, however, was in contractual jobs, as contract workers doubled their share in India's factory employment, from 16% in 2001 to 32% in 2023. The share of directly employed workers in factory employment, meanwhile, declined from 61% to 47% over two decades until 2023.
Employee incomes
While most factory employees are workers, managers make substantially more in incomes. The mean income of a manager/supervisor is more than five times that of a worker.[17] The gap between the incomes of managers and workers has also widened over the last two decades.
Factory workers by state
Since industrial development has been unequal across states, factory employment too is concentrated in some states. The five states that lead in the number of factories also contribute half of the factory employment. Tamil Nadu has over 2.75 million factory workers, accounting for 15% of the country's factory workforce, followed by Gujarat and Maharashtra with 2.5 million factory employees each.
The number of factories in Gujarat has grown at the fastest pace, while it has stagnated in Maharashtra. Maharashtra employed more persons in factories than any other state in 2001. Although factory employment doubled in Maharashtra over the two decades since, states such as Gujarat, Tamil Nadu and Uttar Pradesh grew faster.
Factory workers by sector
The food industry, chemical products, textiles and apparels are the biggest factory employers in India, covering 40% of the total employment.[18]
To understand which factories employ the most people, we look at a more granular classification of industrial activity.[19] The two kinds of factories that employ the most people (more than 750,000 each) are apparel or garment manufacturing, and the production of automobile parts such as brakes and gearboxes.[20]
[1] Provisional estimates of national income for 2022-23, Ministry of Statistics and Programme Implementation, Government of India.
[2] The gross value added (GVA) is the difference between the value of the output and the value of inputs used in the production of goods and services.
[3] Periodic Labour Force Survey, 2022-23. Manufacturing here is defined as activities that fall between two-digit NIC Class 10 and 33, including both.
[4] Statements 8.6.1 and 8.6.2, National Accounts Statistics.
[6] The ASI frame excludes defence establishments, oil storage and distribution depots, railway workshops, currency and coinage mints and a few other enterprise categories.
[7] The ASI is a census of all units in the northeastern states, Ladakh and Andaman and Nicobar Islands, all units in salt extraction, units with 75+ employees in Jammu and Kashmir, Himachal Pradesh, Rajasthan, Bihar, Chhattisgarh and Kerala, those having 50+ employees in Delhi, Puducherry and Chandigarh, and those with 100+ in the rest of the states. From the remaining factories which are largely smaller in size, the ASI surveys a sample of factories.
[8] Annual Survey of Industries, 2022-23.
[9] The ASI 2010-11 introduced a major change in the way the number of factories is estimated. It began counting those units which were non-operational but either had operated at some point during the reference period, or had assets and had produced in the past but did not produce during the reference period for some reason, but could start producing in the future. As a result of this change, the total number of factories appeared to suddenly jump in 2010-11. The total number of factories as estimated from surveys pre- and post- 2010-11 is as a result not comparable, while the number of operational factories is comparable.
[10] Includes units that are open, have employees, and are producing goods, in addition to those which may not be producing goods, but have fixed assets and workers on register.
[11] Subtracting the expenses on the input used in the manufacturing processes from the value of output produced in the factories gives the value added.
[12] The National Industrial Classification classifies a factory or any entity based on the activity it performs. These categories are broad divisions (two-digit) in the NIC.
[13] The ASI also classifies factories based on the products they manufacture (National Product Classification for Manufacturing Sector, 2011).
[14] For a factory unit, the "average number of persons worked" is derived by dividing the number of man-days in manufacturing activity in a year by the number of days of manufacturing activity in that unit that year.
[15] Factory employment as a share of the manufacturing workforce is obtained by dividing the absolute factory employment from ASI by the absolute number of workers with activities that fall in manufacturing (two-digit NIC code between 10 and 33, both inclusive) in the usual status. As a share of the overall workforce, the denominator used is the absolute number of all workers in the usual status in the PLFS 2022-23. Estimates of the manufacturing workforce from PLFS differ from those obtained from industry-side surveys.
[16] Concepts and Definitions, ASI 2023-24.
[17] The average income of directly employed workers (derived by dividing their total incomes by their number) was Rs 225,000 in 2023. A manager on average earned more than Rs 1.3 million a year.
[18] At the two-digit level of National Industrial Classification, 2008.
[19] At the five-digit level of National Industrial Classification, 2008.
[20] The National Industrial Classification of 1998 moved the economic activity of repair of motor vehicles part of it from under Manufacturing, to Trade under the Services sector (NIC 1998). The 1999-2000 series of national accounts followed suit (National Accounts Statistics Sources and Methods - 2007). The ASI, however, continues to consider repair workshops that tend to motor vehicles as a manufacturing activity.


