When goods and services in a country get more expensive, its citizens experience a loss in their purchasing power. The rate at which the prices of a basket of goods and services rises is called consumer price inflation or retail inflation.[1]
How is inflation measured?
Countries measure inflation by monitoring how much the price of everyday items, like food, clothes and fuel, increase over time.
Every ten years,[2] the National Accounts Division in India's Ministry of Statistics and Programme Implementation (MOSPI) selects a basket of commonly consumed goods and services.[3] The amount that an average Indian household needs to spend on it is taken as the benchmark to measure inflation from that point onwards.[4]
To understand changes in the prices of these goods and services, the Price Statistics division in MOSPI conducts monthly surveys to record prices. The monthly changes in the prices of these items help create a monthly Consumer Price Index (CPI), and the percentage change in the CPI over a year gives the annual rate of inflation.
India's inflation over time
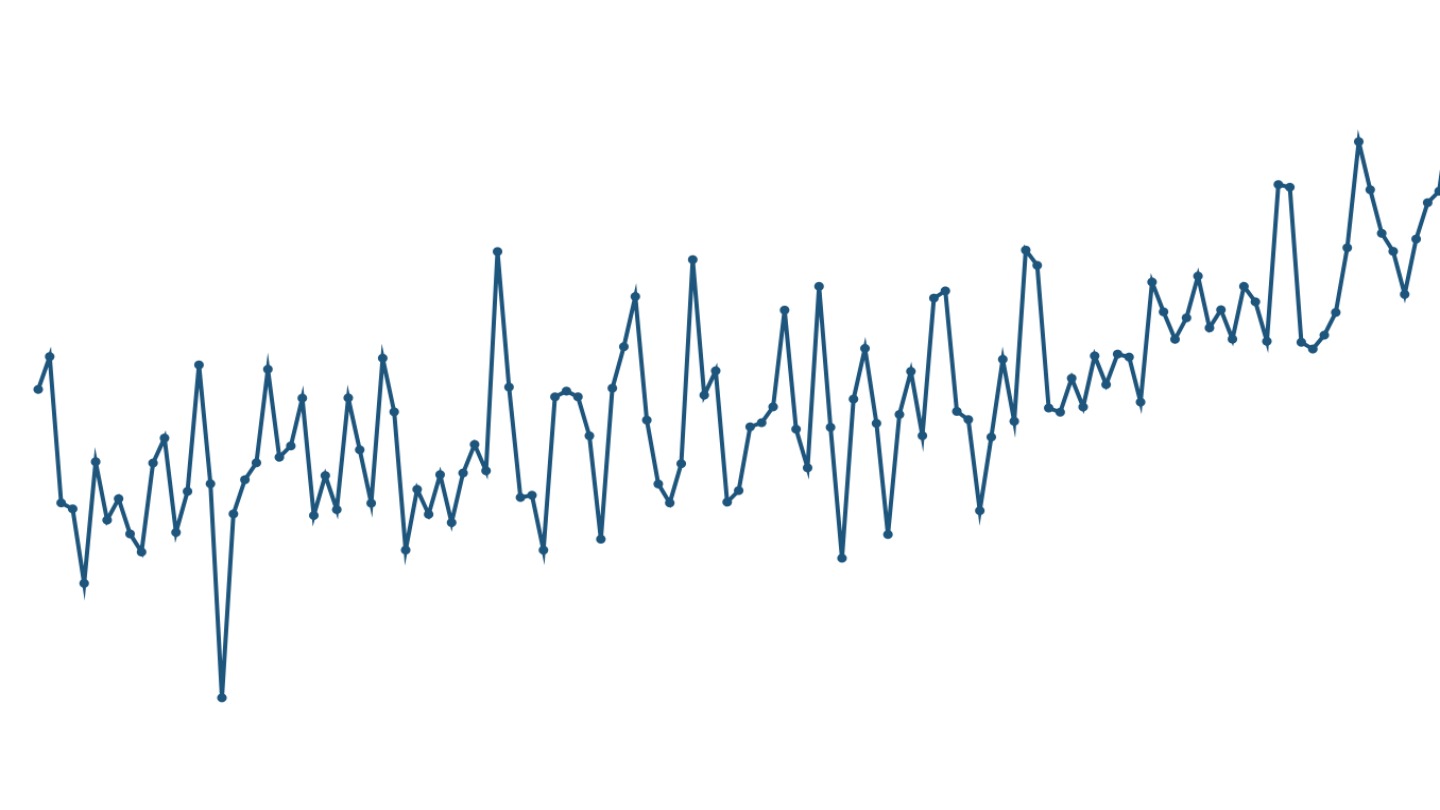
Inflation in India has become lower and less volatile over time. India experienced episodes of high inflation more frequently in the past than in recent decades.[5] Retail inflation crossed the 10% mark multiple times before 2012, but never since then.
Over the last decade or so, annual inflation in India has averaged 5%. This means that an average household had to spend 5% more on goods and services than it did in the previous year. This level is within the band of 2% to 6% that is the inflation target of India's central bank, as laid down by law.[6]
Countries across the world, including India, experienced high inflation after the COVID-19 pandemic; in India this period of relatively high inflation peaked in 2022.
Even though India's overall inflation is low and stable, the prices of specific goods - in particular, food items - sometimes see sudden spikes, typically as a result of weather-related disruptions.
For instance, the price of split pigeon pea (tur or arhar dal), a household staple, doubled from Rs 75 per kilogram to Rs 150 per kilogram in a span of nine months from January to November 2015. Onions became four times more expensive within just four months in 2019.

When such an event happens, households experience a sudden spike in their out-of-pocket expenditure, particularly among the poorest.[7]
Components of inflation
Food inflation
India's consumer price index is a weighted aggregate measure of all goods and services consumed by the average household. Food and food products occupy nearly half the weight in the CPI, and influence retail inflation the most.
Food inflation is generally more volatile than the other parts of the consumer price index owing to supply-demand issues, seasonality, rain-dependent farm production, and other reasons.[8]
To understand inflation in food better, we look at the consumer price index of the sub-groups that are the constituents of the food group in the CPI. For all sub-groups, the CPI in 2012 is considered the base, at 100. A rising CPI means rising prices, a falling CPI means falling prices.[9] A CPI of 200 suggests that prices in that group have doubled from the base year.
Over short periods, the prices of food products can be extremely volatile, rising and falling with seasonal variations. Over the longer term, the prices of food products are slowly rising, with the prices of vegetables, meat and fish, and spices having increased the most from 2012 to 2024. Sugar, milk and fruits saw the lowest inflation.
Despite having many volatile components, food inflation averaged at 5% in India from 2012 to 2024, which is the same as the overall inflation.
Energy and fuels
Similar to food products, there is substantial volatility in the price indices of energy-related consumption items, especially in cooking gas and vehicle fuel, that are linked to the global oil trade that is affected by geopolitical factors.[10]
About half of rural households and more than four in five urban households use LPG for cooking at home. The drastic spikes and falls in LPG prices in the last decade are visible in the volatile index movement, and are directly felt by the majority of consumers.
Petrol prices, although somewhat volatile, have risen slowly in the same period compared to other energy items in the domestic consumption mix.[11]
Other non-food items
The remaining items and item groups that make up the basket of goods and services used to compute general inflation are usually less volatile.
One notable exception is precious metals, which are a part of household expenditure, but are also globally traded commodities. For instance, gold prices are set internationally, and are volatile.
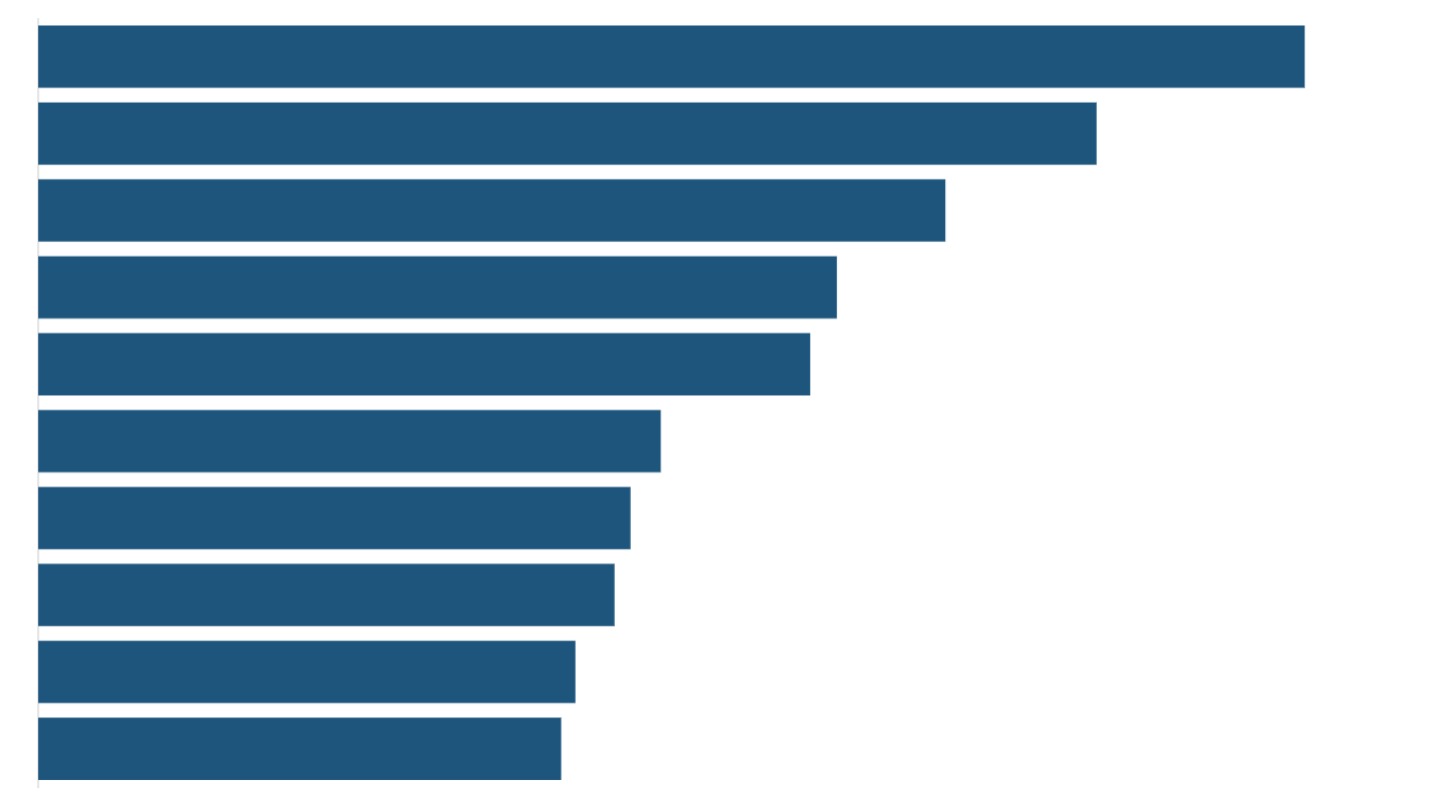
Among the non-food and non-energy items, India experienced highest inflation in health, clothing, and personal care products.
Real impact of inflation
If the prices of goods and services rise faster than incomes, inflation dents the purchasing power of households and has an impact on the "real" or inflation-adjusted standard of living. Conversely, if incomes grow at a faster rate than price rise, households have opportunities to improve their quality of life.
To understand the impact of inflation, we look at three economic indicators - the change in India's per capita Gross Domestic Product over time, the change in its household consumption expenditure, and the changes in wages from labour - and examine whether they have outpaced inflation.
Real per capita income
Over the last decade, India's average per capita income[12] has grown at a rate of 9.5% per year. Since inflation has averaged a little under 5% over the same period, this indicates that per capita income grew at 4.6% per year in real or inflation-adjusted terms.
Real household expenditures
Data on incomes is not collected at the household level in India. In its absence, household spending data is used to assess the impact of inflation on households. The monthly per capita consumption expenditure (MPCE) includes all expenditures on domestic consumption.
In 2012, India's average MPCE was a little less than Rs 1,800. In 2024, it increased to a little under Rs 5,000. This is the nominal MPCE, measured at prices prevailing in 2024.
Adjusted for inflation, however, India's real MPCE was closer to Rs 2,600 in 2024.
While India's nominal MPCE grew 9% every year on average, the country's real MPCE grew at an annual average rate of 3.3% from 2012 to 2024.
This means that household spending did grow in real terms as well, but slower as a result of inflation.
Real wages
India's Labour Bureau maintains monthly data on wages earned by rural workers in various occupations, separately for women and men. Since being an agricultural labourer is one of the most common occupations in India, we look at the impact of inflation on the average annual wages of female and male agricultural labourers over the last decade.
While nominal daily wages earned by general agricultural labourers, both for women and men, rose by close to 6% every year, real daily wages adjusted for inflation rose by only 1% annually from 2014 to 2024.[13]
While income, household spending and wage growth for agricultural labourers in India over the last decade all outpaced inflation, real growth was the slowest when it comes to wages for farm workers.
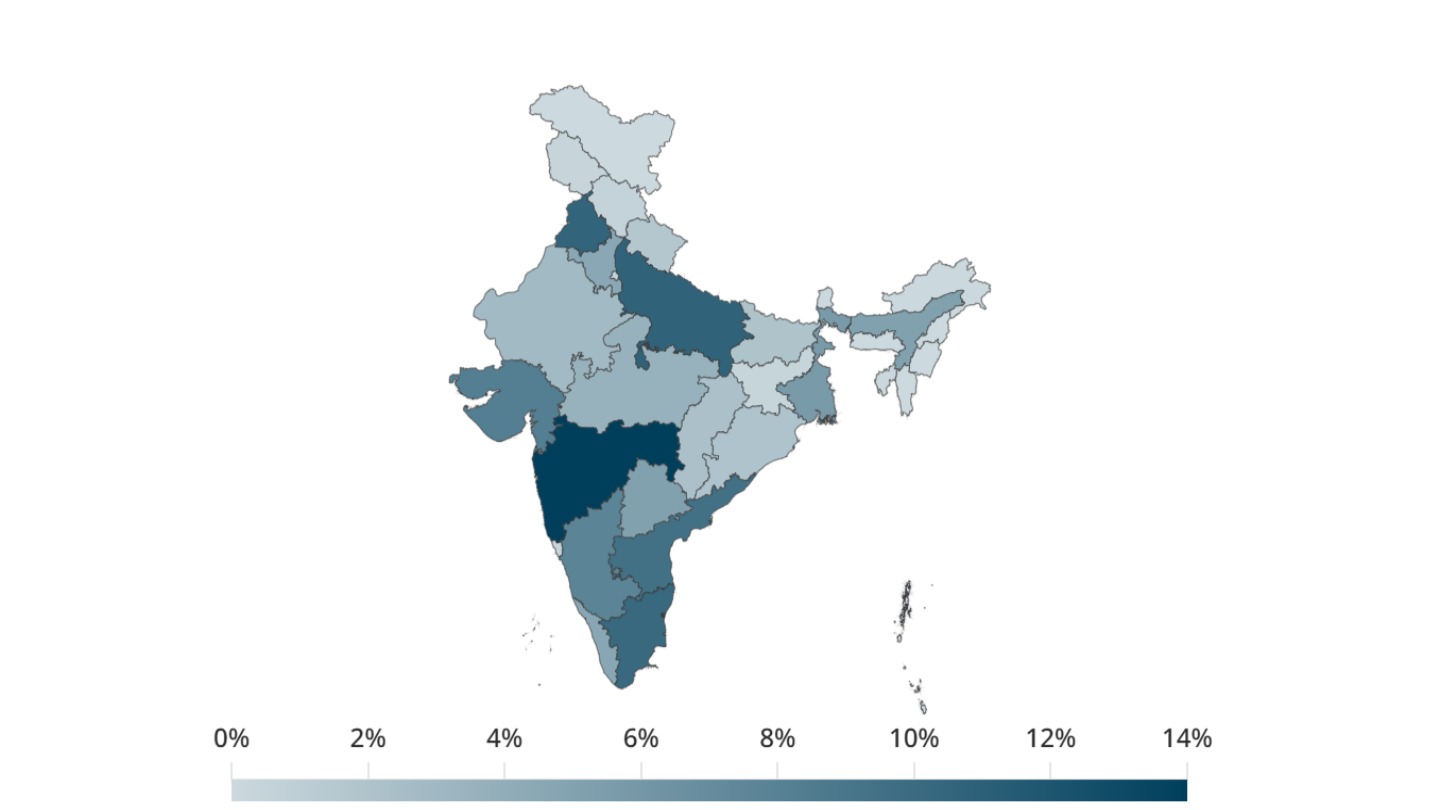
Inflation in states
Price levels of goods and services may vary across states due to supply and demand factors, and consumers in different states in India may experience different inflation levels. As a result, India produces state-wise consumer price indices with the weights of sub-components different for each state.[14] In poorer states, for instance, food may have a higher weight in the basket used to produce CPI than in richer states.
Over time, the gap between the inflation experienced in different states has been narrowing.[15]
Consumers in the southern states have faced the highest inflation in the last decade.
But despite having experienced the highest inflation in the country, three large southern states have also seen some of the highest growth rates in real per capita incomes. While the average annual inflation in Tamil Nadu, Karnataka and Telangana was close to 5.5%, the average real income growth was also close to 6%. These are the high inflation-high income growth states.
In contrast, consumers in West Bengal experienced an inflation of more than 5% for a decade, but their real per capita income grew at a rate less than 4% (high inflation-low income growth). Delhi saw low inflation and low income growth during this period.
Gujarat had the highest growth in real income among large states while having one of the lowest inflation rates.
[1] The increase in the wholesale prices of products, on the other hand, is known as Wholesale Price Inflation.
[2] India's current Consumer Price Index was prepared with 2012 as the base year. A new national CPI with base year 2023 is in preparation as of May 2025.
[3] Each item in the basket of commonly consumed goods has a weight that is proportional to the share it occupies in the household consumption expenditure. Item and group weights differ by state, since the composition of domestic consumption is different in each state.
[4] The expenditure of an average household on these goods and services comes from the Household Consumption Expenditure Survey (HCES) conducted closest to the CPI base year. The basket includes food, essential goods such as petrol and watches, services such as internet and health, durable goods such as television and so on.
[5] In the 1970s, India experienced very high inflation for a few years as a result of a spike in global prices of petroleum and other commodities, and lower domestic food production.
[6] The RBI Act 1934 mandates the central government and RBI to decide an inflation target. The first such set of targets, prevalent today, was agreed upon in 2015 in the Agreement on Monetary Policy Framework.
[7] 86% of households in the poorest quintile spend more than half of their overall budget on food items, as compared to 35% in the richest quintile (2024).
[8] Both the demand side factors, such as income elasticity of demand where the quantity of a product demanded increases with rising incomes, and supply side factors, such as fall in production due to rising costs or inadequate storage facilities, affect the prices of food products at different points in time. Supply-side factors appear more important in the case of pulses, while demand-side factors seem to affect prices of milk and vegetables harder. "Food inflation and volatility in India: trends and determinants", C.S.C. Sekhar, Devesh Roy, Yogesh Bhatt, Indian Economic Review, New Series, Vol. 53, No. 1/2 (December 2018).
[9] At the sub-group and group level aggregations, the CPI is a weighted average of relative prices of various items. Increase in CPI at these levels does not necessarily mean a rise in prices of all items included in the group. For instance, imagine a situation where the price of potatoes increases by 10%, that of cabbage by 15%, but those of green chillies fall by 10% over a year. The overall impact of these movements could result in an increase in the CPI for vegetables due to weighted averaging, despite a fall in prices of some of the component items.
[10] Energy products such as petrol and LPG are produced from raw materials such as petroleum crude and natural gas. India imports the majority of its crude and gas requirements, and since their prices are determined internationally, they influence domestic product prices to a great extent.
[11] Prices of petrol and diesel are decided by oil marketing companies in India, although they have a tax component that is modulated by state and central governments. Prices of LPG to a section of consumers are controlled by the central government through subsidies, and it is also available in the market at market-determined prices.
[12] This is the Net National Income divided by the population, as published by MOSPI.
[13] To get the wage rates in real terms, the nominal wages of general agricultural labourers have been deflated by the rural Consumer Price Index (CPI-Rural).
[14] MOSPI collects data on prices of 299 items across 1181 rural markets (1181 villages) and 1114 urban markets in 310 towns covering all states and union territories, and publishes state-wise consumer price indices each month.
[15] "Inflation convergence across Indian states", Yadavindu Ajit and Taniya Ghosh, Indira Gandhi Institute of Development Research, July 2024.