Most developed countries of the world became richer by moving people from farms to factory jobs. As their income levels rose further, workers transitioned from factory jobs to service sector jobs.[1]
Prominent economists disagree on whether or not manufacturing can become India's primary growth engine, with some arguing that the services sector has more potential for well-paid jobs.[2] Given this debate, it becomes important to understand how many people India's manufacturing sector employs, whether this has increased, and whether their wages are rising.
There are two ways to answer these questions. One is to look at data reported by employers to arrive at a demand-side estimate of manufacturing employment (based on responses from those who demand such labour). The other approach is to look at data reported by employees or households to arrive at a supply-side estimate. Given the definitional differences, the two estimates are not expected to be identical, but they are expected to point in the same direction. However, our analysis shows that the two estimates sometimes point in divergent directions, suggesting that data on manufacturing employment in India needs to be used with caution.
Supply-side estimates provide a significantly larger estimate of the manufacturing workforce compared to demand-side estimates. Supply-side estimates also suggest a sizeable expansion of the manufacturing workforce in recent years. Demand-side estimates indicate a mild contraction in the manufacturing workforce. These trends hold true for most industry groups, and for most large states of the country (states with population above ten million in 2011 census).
The trends in wage growth are different. In recent years, demand-side wage estimates have come closer to supply side-estimates. But this convergence in averages hides big differences between the two sets of estimates for specific industries. Additionally, while demand-side estimates show a strong rise in real (inflation-adjusted) wages in recent years, supply-side estimates show a slight fall. These trends also vary considerably from state to state.
Data sources
Our analysis of supply-side estimates is based on household employment details from the periodic labour force survey (PLFS) and the employment-unemployment survey of 2011-12. In this analysis, we will refer to all such estimates as Household Survey (HS) estimates.
The majority of manufacturing workers are in the unorganised sector, but the share of the organised sector is rising.[3] Our analysis of demand-side estimates is based on data from the Annual Survey of Industries (ASI)[4], which covers registered factories, and data from unorganised sector surveys which cover unregistered units and the self-employed.[5] [6] Pooled estimates from these two databases provide us with a demand-side measure of manufacturing employment. In this analysis, we will refer to such estimates as Enterprise and Establishment Survey (EES) estimates.[7]
How many people does India's manufacturing sector employ, and has this increased?
We first examine the similarities and differences between the number of manufacturing workers estimated by HS and EES data sources.
HS estimates suggest that the number of manufacturing workers in India fell by four million between 2011-12 and 2017-18 to 55.4 million. Over the next five years, however, nearly 13 million workers joined their ranks, taking the total number of manufacturing workers in the country to 68.5 million in 2022-23.[8]
In contrast, the EES estimates suggest a nearly static manufacturing workforce. Between 2011-12 and 2017-18, the number of manufacturing workers rose by 1.5 million to reach 49.5 million according to the EES estimates. Over the next five years, however, the number of manufacturing workers shrank by 1.1 million to reach 48.4 million workers, the EES estimates suggest. The latest estimate is not very different from the 2011-12 EES estimate of 48 million.
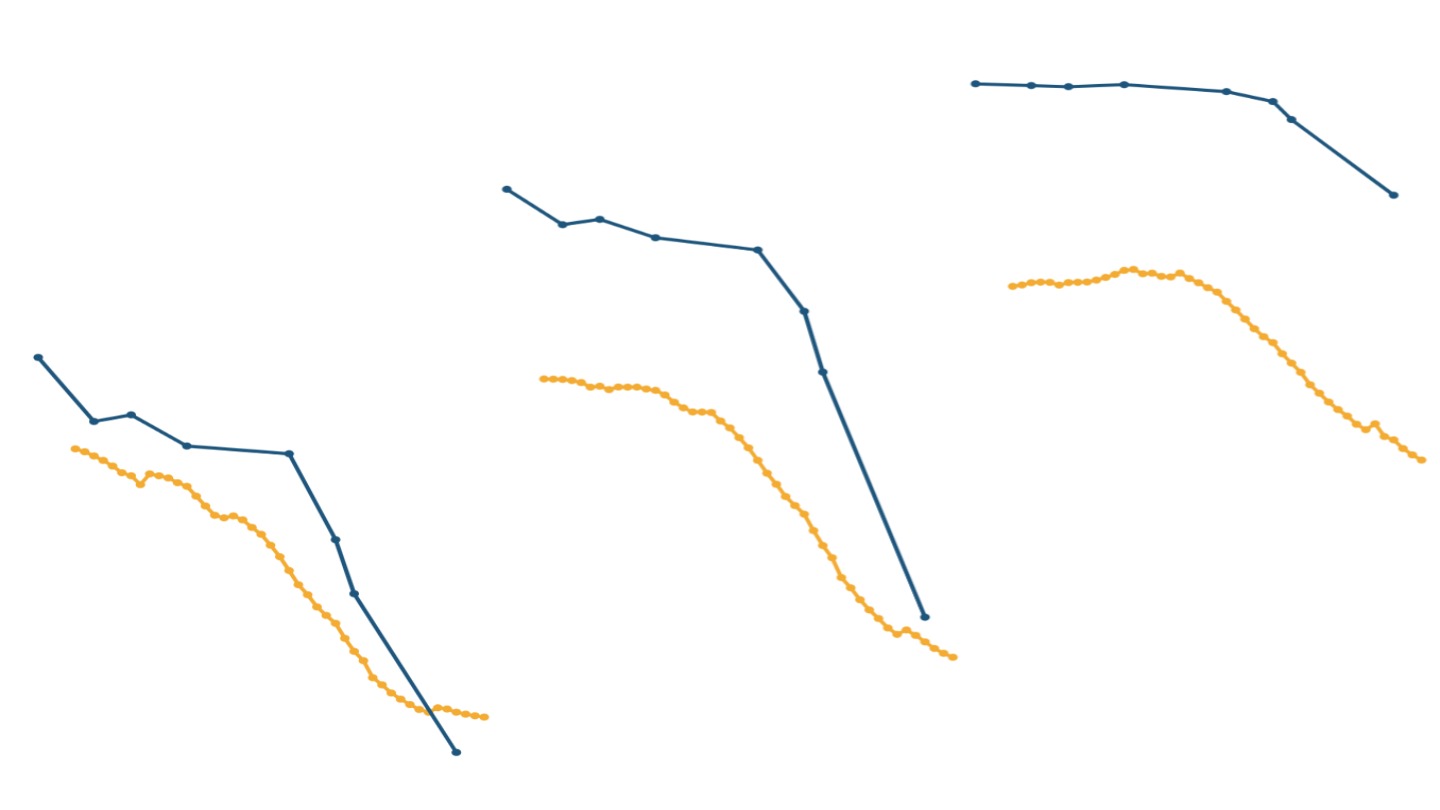
Across years, the HS (supply-side) estimates of manufacturing employment are much higher than the EES (demand-side) estimates.[9] This holds true across major industry groups, as the chart below shows.
Why do the estimates differ?
How workers are defined
One reason for the difference between the two estimates lies in the definition of workers in EES estimates. Unlike in the case of household surveys, the number of workers in enterprise and establishment surveys pertain to the staff strength of these firms, and not to the actual number of people who may have been employed in the reference period. So, if a factory employed four different workers in the four quarters of the reference year by turns for the same position, and none of them worked elsewhere during the rest of the year, all of them would collectively be considered as one worker. However, all of them would be considered as distinct (subsidiary status) workers in household surveys. In contrast, a factory worker who also runs a small-scale manufacturing unit at home will count as one worker in HS estimates, but will be counted twice in EES estimates.[10]
A second and related issue is the treatment of family members and unpaid workers, who may not be employed throughout the year. Household surveys are likely to capture such workers better. Further, fluctuations in the ranks of such workers across time and space can confound analyses of worker counts. To deal with this issue, we examine trends in the number of paid workers with regular earnings.[11]
Once we exclude unpaid and temporary workers, the gap between the HS and EES estimates reduces to some extent. Both sets of estimates now suggest a rise in paid manufacturing employment over the past decade. According to the HS estimates, the number of paid workers rose by 11 million over the past decade to 59.3 million in 2022-23. According to the EES estimates, the number of paid workers rose by 3.5 million over the same period to 43.5 million. Still, the HS estimate in 2022-23 is 36% higher than the EES estimate.
Across broad industry groups such as textiles and leather products, or food and tobacco products, HS estimates of paid workers were higher than EES estimates.[12] Similarly, HS estimates of paid workers were higher than EES estimates for almost all major states (population above 10 million) in 2022-23. The exceptions are Himachal Pradesh (EES count 25% higher than HS count) and Uttarakhand (EES count 14% higher). The trends for states are similar in previous years, and in line with the national trend for most states.[13]
How population adjustments are made
Beyond definitional differences, HS and EES estimates differ in how adjustments are made to address non-sampling errors.[14] For instance, household surveys rely on dated census counts[15] to draw samples and to calculate survey weights.[16] The NSO has acknowledged in the past that the weighted counts of workers are likely to underestimate the 'true' count of workers because of such non-sampling errors.[17] The recommended method of estimating HS worker counts relies on multiplying the worker-population ratios obtained from household surveys with the Registrar General of India's (RGI's) population projections. This method aims to correct the undercount of people in NSO's household surveys. However, since RGI projections tend to lose precision over time, this method could introduce biases, especially at the regional level.
Surveys of unincorporated enterprises[18] also rely on outdated databases - population and economic censuses[19] - to select sampling units and to calculate sampling weights. However, unlike in the case of household surveys, no population adjustment is made while estimating the number of workers from surveys of unincorporated enterprises. Hence worker estimates from enterprise surveys may underestimate the 'true' count of workers.
Are wages for manufacturing workers rising?
How far do gains in employment translate into gains in earnings for workers? Both HS and EES estimates capture data on average wages, which we use to compare the trends across industries and regions. As in the case of worker counts, there are methodological differences between HS and EES wage estimates.[20] However, as in the case of worker counts, the two estimates are expected to point in the same direction.
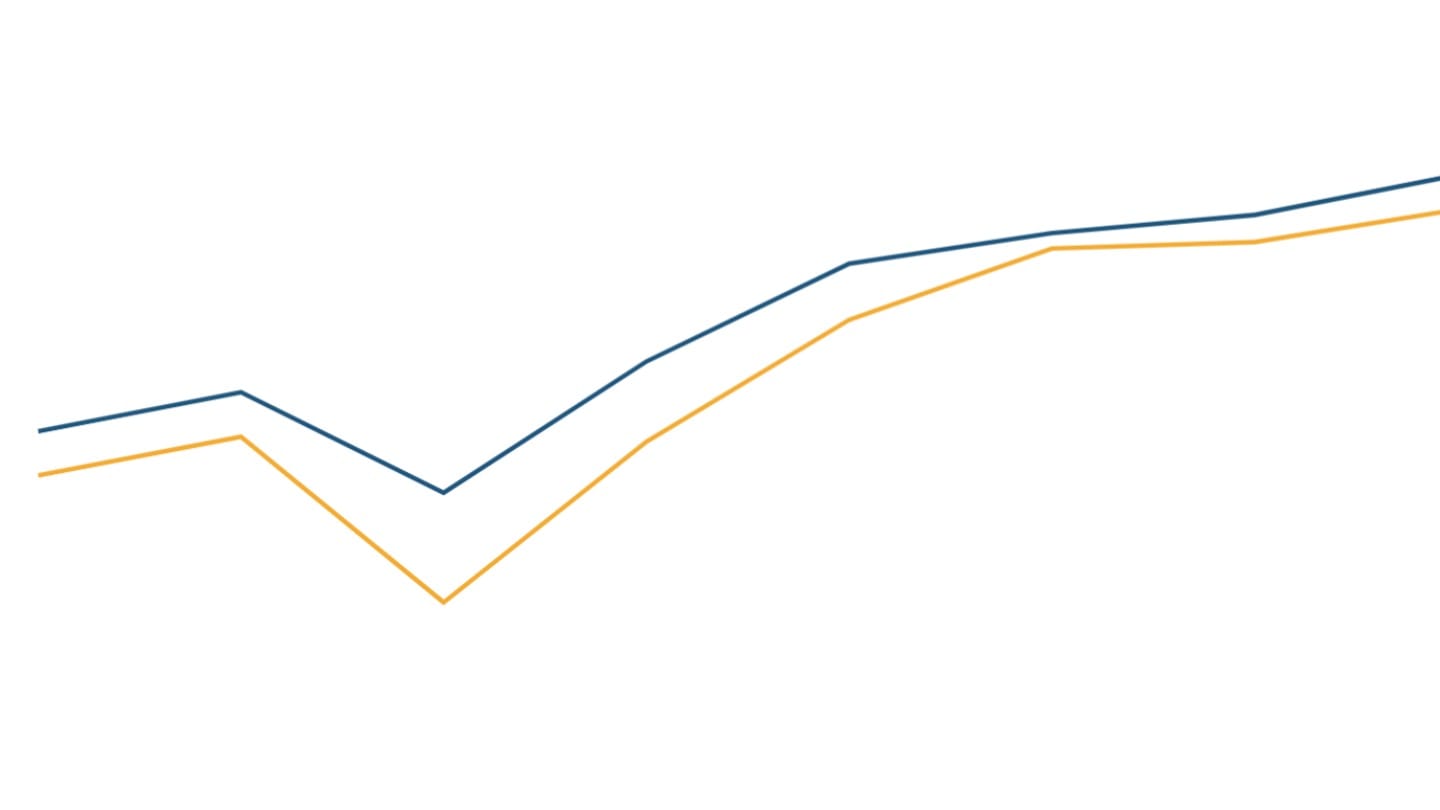
In 2017-18, the EES wage estimate was 13% lower than the HS estimate. However in 2022-23, the EES average manufacturing wage estimate was 5% higher than the HS estimate. In other words, the EES estimates suggest a much higher growth in wages as compared to HS estimates. For real (inflation-adjusted) wages too, EES estimates indicate an impressive increase, while HS estimates suggest a mild contraction in recent years.
There are significant differences between HS and EES wage estimates across industries. EES estimates suggest larger wage differences across industries compared to HS estimates. For instance, wages in the machinery, electronics and transport equipment industry group are roughly five times the wages in the textiles and leather products industry group, according to the EES estimates. But according to the HS estimates, workers in the former industry group earn only twice as much as those working in the textiles and leather products industries. We were unable to trace any research on the reasons behind such differences.
Which data sources should we use to track manufacturing in India?
In summary, both HS and EES estimates show that the number of paid manufacturing workers in the country has gone up over the past decade. But the two estimates disagree over the pace of the increase. HS estimates suggest a more rapid pace of increase in the workforce compared to EES estimates.
For most industries, HS estimates of the workforce are higher than EES estimates. While both estimates suffer from limitations discussed above, HS estimates of the workforce adjust for population undercounts, and may be more accurate than EES estimates at the national level.
HS estimates, meanwhile, present a less optimistic picture of wage growth compared to the EES estimates. Given significant differences in wage estimates across industries and states, the choice of estimates for average wages will need more research.
[1] The transition from farms to factories may have stalled in the developing world, some economists worry. In a much cited 2016 research paper, the development economist Dani Rodrik argued that manufacturing employment may have peaked in most parts of the developing world even before these countries could get richer. Rodrik termed this phenomenon 'premature deindustrialization'.
Other economists have challenged this hypothesis. Armed with more recent data (for a wider set of countries), the economists Hagen Kruse, Emmanuel Mensah, Kunal Sen and Gaaitzen de Vries have claimed that the developing world is witnessing a manufacturing 'renaissance'. The deindustrialization trend observed by Rodrik no longer holds true, they argue. Several countries in Asia and Africa have witnessed a rise in manufacturing employment since 2010, their analysis suggests.
[2] The economists Raghuram Rajan and Rohit Lamba have argued that India has a better chance of creating well-paid jobs in the services sector than in manufacturing. The economists Amrit Amirapu and Arvind Subramanian have argued against this view, insisting that manufacturing remains the best bet to create shared prosperity in the country.
[3] As per EES estimates, the organised sector accounted for 27% of manufacturing workers in 2011-12, while the unorganised sector made up 73%. By 2022-23, the organised sector's share rose to 37%, compared to 63% in the unorganised sector.
In this analysis, all 2-digit industry groups ranging from 10 to 33 under the National Industrial Classification (NIC) 2008 are considered to be part of the manufacturing sector. We apply this classification uniformly across household and enterprise surveys.
[4] The Annual Survey of Industries (ASI) is an annual database of factories and industrial establishments going back to the 1950s. All factories (barring a few exempted ones) registered under the Factories Act have to mandatorily fill in the ASI schedules and send them over to the National Statistical Office (NSO) along with copies of their balance-sheets. NSO staff may make field visits to verify these returns and ask for additional details in case they suspect any misreporting or mismatch (between the balance sheet details and the ASI schedules). ASI covers all large factories (with 100+ workers) on a census basis, and uses representative random samples to cover smaller factories in each industry.
[5] For workers employed in the unorganised manufacturing sector (units not registered under the Factories Act), we use data from the Annual Survey of Unincorporated Sector Enterprises (ASUSE) and its predecessor surveys. Prior to the launch of ASUSE in 2021-22, enterprise surveys were carried out on a quinquennial basis. The last two rounds were held in 2015-16 (NSS 73rd round) and 2010-11 (NSS 67th round). Since these years differ from the years for which we have employment data from household surveys, we use an interpolated series based on the 2010-11, 2015-16, and 2022-23 data to arrive at figures for 2011-12 and 2017-18. We avoid using the ASUSE data for 2021-22 since it took place in the immediate aftermath of the COVID-19 pandemic (which caused a major disruption in the activities of the unorganised sector).
[6] Co-operative enterprises were not covered in the NSS 67th and 73rd rounds, but they are included in ASUSE. In ASUSE 2022-23, workers in unincorporated co-operatives accounted for less than 0.01% of total workers in manufacturing. Since co-operatives were not recorded as a separate category across all the survey rounds considered in this analysis-for instance, in the EUS 2011-12 they were grouped within a broader enterprise-type category along with trusts and other non-profit institutions-dropping them would require excluding these entities from all surveys used in our analysis. Given their negligible share within the unincorporated sector, their absence in the NSS 67th and 73rd rounds is unlikely to affect the estimates. We therefore retain co-operative workers in our analysis rather than excluding them.
[7] EES estimates for 2022-23 refer to the sum of ASI and ASUSE estimates for 2022-23. EES estimates for the previous years (2011-12 and 2017-18) refer to the sum of ASI and interpolated figures from the unincorporated enterprise surveys pertaining to those years. Establishments refers to enterprises, or parts of enterprises situated in a single location (such as a factory). The enterprise and the establishment are the same for single-establishment firms.
[8] Household survey data suggests that the share of manufacturing workers in the overall workforce has not changed much over the past decade. The share of manufacturing workers was 12.6% in 2011-12, declined to 12.1% in 2017-18, and fell to 11.7% in 2022-23. In all of these years, the share of paid manufacturing workers in the total paid workforce has remained nearly constant at about 11%.
[9] Comparing trends in data recorded by household surveys with those recorded by ASI, the economist Bishwanath Goldar concluded that household surveys may have underestimated the growth of manufacturing workers between 2011-12 and 2017-18. However, since most manufacturing workers are employed in the unorganised sector and are not covered by ASI, the ASI figures are not directly comparable with the household survey numbers. The statistician P.C. Mohanan's analysis of more recent data on manufacturing units suggests a significant contraction in the unorganised sector in recent years. Mohanan attributed the contraction to the twin shocks of demonetisation and the implementation of the goods and services tax (GST) in the 2016-17 period.
[10] She would be counted once as a factory worker in the organised sector survey, and once as a factory owner-cum-worker in the unorganised sector survey.
[11] Our estimates of paid workers with regular earnings identified using household survey data include self-employed individuals, regular wage or salaried employees, and casual labourers, identified based on their principal activity status. Subsidiary workers are excluded. In enterprise and establishment surveys, we include full-time working owners, formal and informal hired workers from the unorganised sector, and directly employed workers, those hired through contractors, and managerial or supervisory staff from the organised sector.
[12] Both HS and EES estimates suggest similar patterns of industry-wise shares in overall paid employment in manufacturing. As per both estimates, the textiles, apparel, and leather products industry group has been the biggest employer over the past decade, accounting for roughly a third of overall manufacturing employment. HS and EES industry shares differ for two industry groups: furniture and wood products (HS shares consistently higher across years), and food, beverages, and tobacco (EES shares consistently higher across years).
[13] There are two other exceptions for earlier years. In 2011-12 and 2017-18, undivided Andhra Pradesh (inclusive of Telangana) and Chhattisgarh reported higher EES counts of paid manufacturing workers compared to HS estimates. In 2022-23, EES counts were lower than HS estimates in these states.
[14] Non-sampling errors refer to all sources of error not related to fluctuations of sampling. There could be several sources of such errors: incomplete or outdated sampling frames, false entries by interviewers, or incorrect responses or measurements. One example is the incorrect reporting of the industry or occupation in which a person is employed. Another example is the use of outdated population frames for designing surveys and generating survey weights. These errors can introduce biases in the final estimates.
[15]The household surveys conducted by NSS use the most recent population census as the sampling frame for rural areas and the latest available Urban Frame Survey (UFS) for urban areas. These frames are used to select first-stage sampling units, allocate samples across strata, and compute survey weights. While the UFS is updated periodically, the rural frame is revised only after a new census is conducted. The greater the distance between the year of the survey and the year of the last census, the higher the risk of outdated frames and erroneous survey weights.
[16] Survey weights indicate how many population units each sampled unit-such as an establishment, household, or individual-represents. They are used to scale up sample counts to population counts, ensuring that survey results are representative.
[17] Review of Concepts and Measurement Techniques in Employment and Unemployment Surveys of NSSO (2008), Rajiv Mehta et al., NSSO (SDRD) Occasional Paper/1/2008.
[18] These refer to enterprises not registered under the Companies Act. Enterprises or establishments covered under the Factories Act are also excluded from surveys of unincorporated enterprises.
[19] ASUSE uses the population census (for rural areas) and the Urban Frame Survey (for urban areas) as the primary sampling frames, supplemented by information on enterprise or non-agricultural worker counts from the last Economic Census (2013). The Economic Census data is used to select sampling units, allocate samples across strata (and sub-strata), and to compute sampling weights. ASUSE's predecessor surveys relied more heavily on the Economic Census.
The Economic Census has faced criticism from within the statistical establishment for missing unregistered units, and for underestimating the counts of workers. See for instance, 'Current Status of Industrial Statistics in India: Strengths and Weaknesses (2010)', G.C. Manna, Economic and Political Weekly and 'Brochure on new series on National Accounts Statistics (1993-94)', CSO (1999).
[20] HS collects wage and earning data separately for regular salaried workers (monthly), casual workers (weekly), and the self-employed (monthly). It reports daily wages received or receivable for casual labourers, gross monthly earnings in cash and kind for regular salaried workers-including payments for work done, paid leave, and apportioned bonuses-while excluding employer contributions to social security. For the self-employed, it records net monthly earnings. We convert weekly wages reported for casual workers in PLFS to monthly equivalents.
ASI provides the annual total wages paid to all categories of workers, which we convert to monthly values. ASUSE directly provides monthly wage data. We derive the EES average wage as a weighted average of the ASI and ASUSE estimates. ASI includes basic wages, allowances, bonuses, and paid leave, but excludes employer contributions to social security, group benefits, and reimbursements. ASUSE covers salaries or wages, house rent and transport allowances, bonuses, and other individual benefits in cash or kind paid to hired workers and working owners.
The wage estimates from PLFS are not strictly comparable with the Employment-Unemployment Survey of 2011-12, as the latter did not collect earnings data for the self-employed. Since PLFS estimates are available only from 2017-18, we restrict our wage analysis to the period between 2017-18 and 2022-23.