The Periodic Labour Force Survey (PLFS) is India's main data source on employment, wages, and related labour market trends. Launched in 2017, it is used to track the pace of job creation across different states and industries. In this piece, we explain the evolution of PLFS, its methodology, its uses, and some debates about its comparability with earlier employment surveys.
The evolution of employment surveys in India
The absence of basic data on living conditions and economic activities in the early years of India's independence led policymakers to set up a nation-wide household survey programme in 1950: the National Sample Survey (NSS). The first NSS round, conducted in 1950-51, collected a wide range of socio-economic data, including employment details of households.
However, there was much debate about the best way to collect data on employment, and questions relating to employment saw several iterations in subsequent NSS rounds.
India's economic statisticians felt that the international standards for measuring employment and unemployment had to be adapted to suit Indian conditions. Unlike in advanced economies of the West, most people in India did not work in full-time 'jobs' throughout the year. Instead, they worked intermittently in family farms and household enterprises. A very conservative definition of employment would exclude such workers from the workforce, deflating the share of employed in the country.[1] A very liberal definition would include even those who barely worked through the year, inflating the share of employed in the country. The early NSS rounds employed different definitions based on different recall periods[2] to track fluctuations in the labour market.[3]
In the early 1970s, the methods of collecting employment data were finalised, based on the results of the early NSS experiments, and the recommendations of an expert committee.[4] The new methodology was implemented in NSS' 27th round (1972-73) and refined further in the next five-yearly round (1977-78). All subsequent official employment surveys - including the PLFS - have adopted a broadly similar approach to measure employment-unemployment trends in the country.
As India's growth engine picked up pace, policymakers increasingly felt the need for more frequent labour market updates. Following the recommendations of an expert committee[5], pilot studies in three states[6] and after several rounds of deliberations, the PLFS was launched in 2017-18.
Until 2024, the PLFS was used to generate quarterly employment estimates for urban India. Rural and all-India estimates were available on an annual basis. The PLFS underwent a major change earlier in 2025 when the sample size was increased, and the sample design was modified to enable the generation of monthly estimates for both rural and urban India.[7]
How the survey is done
Like other official large-scale household surveys run in the country, the PLFS uses a multi-stage stratified sampling strategy to ensure that precise state and national-level estimates can be obtained for each key demographic group. Towards that end the rural and urban areas are sub-divided into relatively homogenous sub-units or 'strata'[8], and villages or urban blocks within those strata are then selected at random. The selected villages/hamlets/urban blocks are termed as 'first stage units' or FSUs.
Enumerators from the National Statistics Office (NSO) then visit each FSU to conduct a house-listing exercise. A unique code or identifier is assigned to each household, and basic demographic details - such as household size and educational qualifications of household members - are collected by the field staff.
All the FSU households are then assigned to three to four different bins or strata, based on the number of members in the household who have studied until grade 10 or higher. The education data collected during the listing phase is used for the household-level stratification.[9] A fixed number of households from each stratum are then selected at random[10] for the survey. The household-level stratification is intended to capture diverse socio-economic groups more effectively, allowing the survey to better reflect differences in their employment outcomes.
The main questions
As in earlier NSS five-yearly rounds, the key variables of interest in the PLFS are: the employment status of household members, the industry in which they work, the type of enterprise/organisation in which they work, and their earnings.
The work status of individuals - whether working, unemployed, or out of the labour force - is determined in two different ways. In one method, their status is determined on the basis of how they spent the major part of the year. This is referred to as the individual's 'usual activity status' or 'usual status'.
Someone who wasn't looking for work, or available for work, for most of the year is classified as 'out of the labour force'. The rest are considered to be part of the labour force. Within the labour force, a person who was employed for the greater part of the period during which she was in the labour force is classified as a 'principal status' worker.[11] Someone who worked for a relatively shorter period (but at least one month) is classified as a 'subsidiary status' worker.[12] The two categories of workers taken together constitute the aggregate usual status workforce. Those who are part of the labour force but did not qualify to be considered as either principal or subsidiary status workers are considered unemployed as per the usual status criterion.[13]
In the second method, the work status of individuals is determined on the basis of daily time disposition data in the week preceding the survey. Anyone who worked for at least an hour in the reference week is classified as a worker in this method. The rest are classified as either unemployed or out of the labour force based on whether they were seeking or available for work in the reference week. This status is referred to as the 'current weekly status' of the individual.
As a result, an individual can be employed as per one criterion - say on the basis of her current weekly status - and yet be 'out of the labour force' as per the other criterion if she has reported being unavailable for work for the major part of the reference year.
The usual status workforce estimates are typically used to compare long-term labour market trends while the current weekly status estimates are used to compare short-term changes and seasonal fluctuations in the labour market.[14]
Revisiting households
The PLFS uses a 'rotational panel' approach[15] in which half of the sample is repeated each month while the other half is replaced with a new sample. The panel of FSUs is drawn in such a way that only a sub-sample of FSUs is visited in the first month of the survey to conduct house-listing operations and begin the survey process. Enumerators revisit these FSUs thrice in successive months to record changes in the employment situation of the sampled households (the household listing operation is not repeated during revisits) and use a truncated questionnaire for this purpose.[16] After four visits, enumerators pick a fresh FSU sub-sample and begin this process once again.[17]
The rotational panel approach is used in labour force surveys globally to help capture short-run changes in labour markets efficiently.[18] It is possible to track the churn in labour markets (new jobs, job losses, and withdrawals from the labour force) with greater precision in these surveys than in traditional surveys where the entire sample is picked anew in each round (or sub-round).
Until 2024, only urban households, where employment trends are more dynamic, were revisited - on a quarterly basis - while rural households received only one visit from PLFS enumerators.[19] This allowed NSO to generate quarterly employment estimates for urban India, and annual estimates for rural India. From January 2025, enumerators have begun revisiting each household in the sample (both rural and urban) three times. This change in the sampling method, coupled with the expansion in sample-size, has enabled NSO to come up with monthly employment estimates for rural and urban India (based on the current weekly status approach).
How the PLFS data is used
The PLFS data has been used by a wide spectrum of researchers, government officials and financial analysts to study different aspects of India's labour market.
Unemployment trends
Economists have used the PLFS data to track the unemployment rate across the country, and in key demographic groups. Some labour economists have used the PLFS data to highlight the high rates of unemployment among India's educated youth, and the vulnerable nature of jobs in which young workers find themselves.[20] The gap between the supply of graduate workers and the availability of high-skilled employment opportunities has increased over time, one analysis of PLFS data suggests.[21]
Sectoral shares
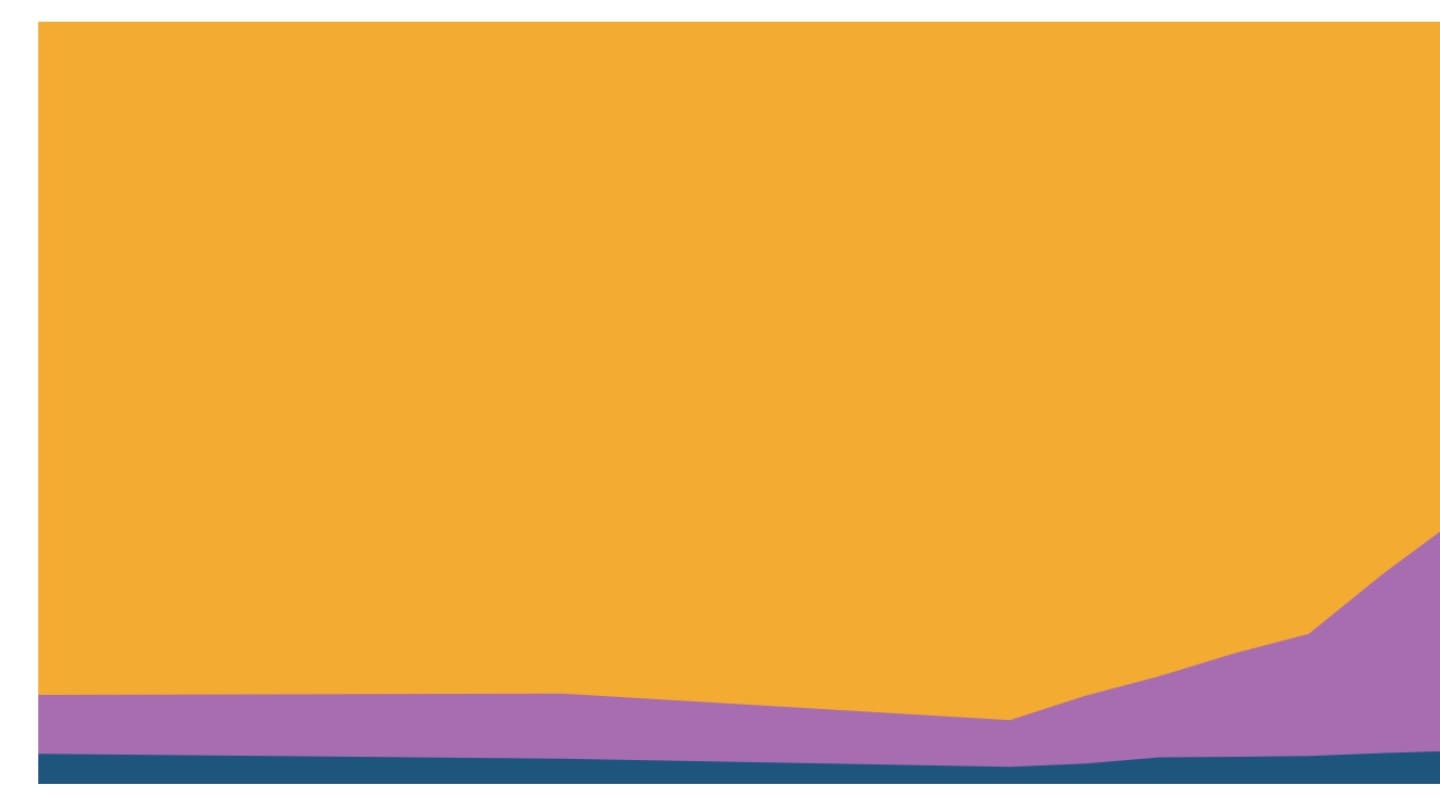
The PLFS data has been used to track the transition from farm-based employment to non-farm jobs in the country. Combining data from PLFS rounds and earlier PLFS surveys, some researchers have argued that the shift from farm-based employment to non-farm jobs has been slow in India.[22] Even as the farm sector's share in economic output has fallen sharply over the past few decades, it still remains the largest employer in the country.
Wages and quality of employment
Researchers have used PLFS data to assess how wages of workers have grown over time, and how many of them are able to find a regular job. One study found that the share of workers with a regular job increased steadily from the mid-2000s until the pre-pandemic period.[23] Another study suggests that wage growth has been weak even as overall employment opportunities have expanded in recent years.[24] Despite the rising share of regular jobs, employment in India is pre-dominantly self-employment and casual employment, which tend to generate low earnings.[25]
Occupational disparities
Researchers have used data from PLFS and earlier NSS rounds to assess intergenerational mobility over time. Findings suggest that intergenerational mobility in India has increased in the last two decades, with more sons entering jobs that are less informal, better paid, and located in non-agricultural sectors compared to their fathers. Mobility has improved for all castes. Yet, marginalised groups including Scheduled Castes and Scheduled Tribes are much more likely to be in low-wage occupations than other caste groups.[26] The gender gap in the earnings of regular workers fell between 2004-05 and 2017-18, but has stalled since then, one study finds.[27]
Macroeconomic monitoring
As the monthly PLFS data stabilises, it could become an important policy input for the Reserve Bank of India's (RBI's) monetary policy committee. In most large economies, central banks keenly monitor employment and labour force participation rates, and change benchmark interest rates[28] depending on the state of the labour market. The introduction of PLFS monthly data could see that happening in India too in the coming years. The PLFS data is also likely to be used to revise India's national accounts estimates in the ongoing base revision exercise.[29]
Making use of the revisit data
The rotational panel feature of the PLFS survey presents an opportunity to precisely track labour market transitions over short periods of time by identifying individuals whose employment situation changed across sub-rounds (an unemployed worker who found a job, or an employed worker who lost one). Such studies are quite common in other large economies. But in India, such studies are hard to find since the identifiers for sampled households are not consistent across sub-rounds, making it difficult to make sense of the revisit data. Several researchers have drawn attention to this issue, and urged NSO to recode the revisit households.[30] [31]
Key debates
Although the PLFS remains the most widely used employment database in the country, it has faced critical questions on data quality and on comparability with earlier five-yearly NSS surveys.
Stratification methodology
Some researchers have raised questions about the change in the second-stage (household level) stratification strategy used in the PLFS. While the PLFS uses educational attainments to stratify households, earlier NSS surveys used wealth or consumption levels to stratify households. This change is feared to have introduced biases in the PLFS estimates since the rates of unemployment are higher among the educated sections of society. Such fears are unfounded since NSO takes into account the share of each stratum in the population while calculating the survey weights.[32] As with other NSS surveys, the weighted estimates published in PLFS reports are unlikely to under-represent or over-represent any demographic group.[33]
Counting women's work and unpaid work
Some researchers have expressed concerns about employment concepts and definitions used by PLFS and earlier NSS surveys since they may not capture all forms of work equally well.
For instance, enumerators may have missed out irregular activities of informal workers, especially women, who may be engaged in multiple 'jobs' during the course of a day, some researchers have argued.[34] Others have argued that expanding the official definition of employment to include all forms of 'economically gainful' activities - such as collection of firewood or fish - raises female workforce participation rates and reduces their volatility across time.[35]
Given the high share of women in unpaid work, as well as those out of the labour force, the distinction between an 'unpaid helper' in a household enterprise and someone attending to 'domestic duties' may not always be clear to enumerators, some researchers argue.[36] [37] A change in the definition of subsidiary work in 2004-05 may have added to the measurement challenges.[38]
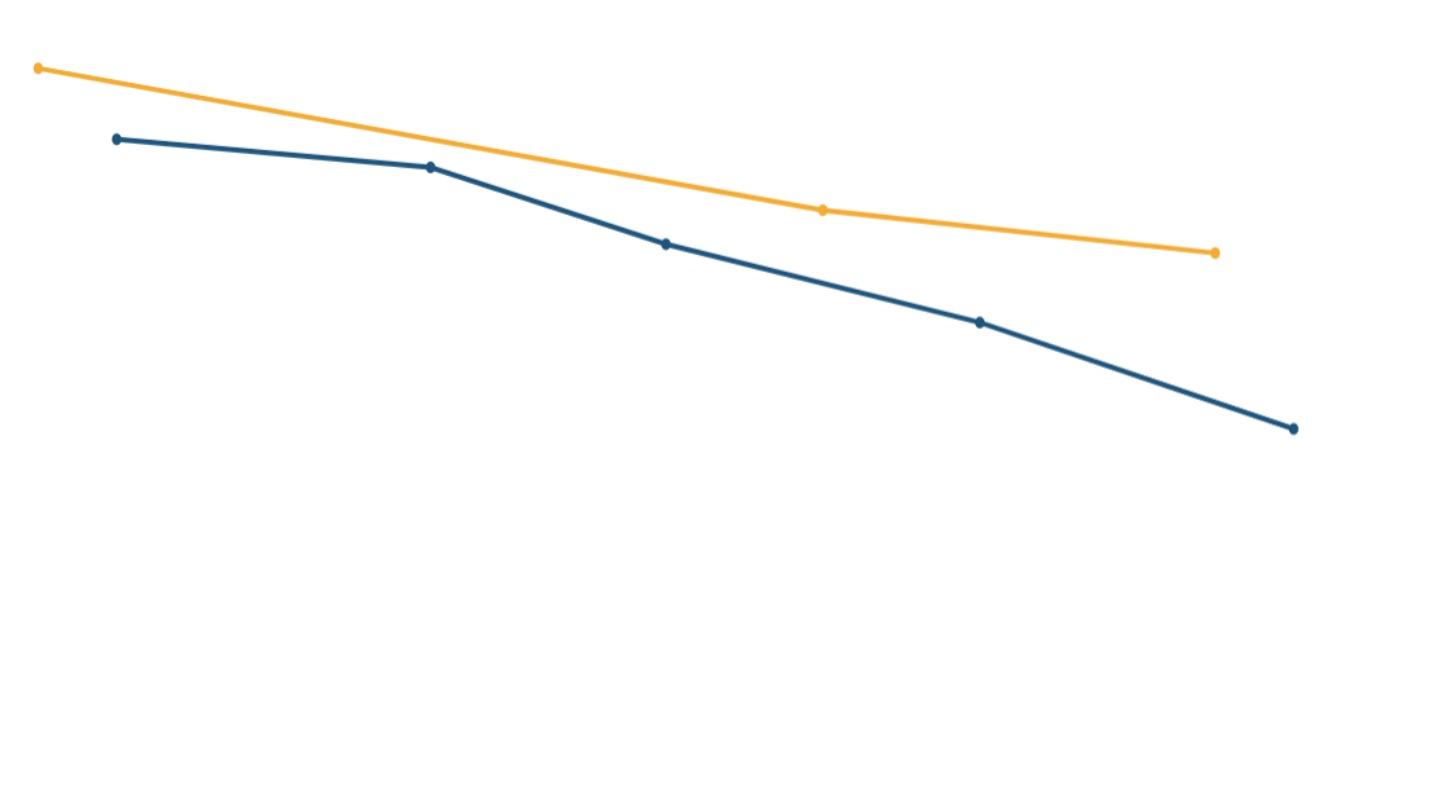
If we look at the changes in the number of paid workers[39] alone, we do see that the fluctuations in the ranks of paid workers has been less than in the case of all workers over the past four decades. However, whether the fluctuations in the ranks of unpaid workers over the past two decades reflect measurement issues or actual labour market shifts has not yet been established.
Some scholars have suggested that we need to complement data from labour force surveys with those from time use surveys (TUS) to understand women's participation in economic activities better.[40] [41]
ILO's use of early PLFS rounds
The data quality of the early PLFS rounds have been questioned by some researchers[42] after the International Labour Organization omitted the first two PLFS rounds as inputs for their modelled estimates, citing 'limited comparability' with other PLFS rounds and earlier NSS surveys.[43] Other researchers have argued that the ILO's judgement on this issue is questionable. Once we exclude subsidiary (or temporary) workers, the trends in workforce participation in the early PLFS rounds do not appear out of sync, they argue.[44]
In response to DFI's queries on this issue, ILO's statisticians have clarified that the ILO continues to use all PLFS rounds in their labour force survey database (ILOSTAT LFS database). ILO has only omitted the first two rounds as inputs in its modelled estimates since data points from those rounds seemed to be outliers. Given that PLFS surveys (and earlier NSS surveys) rely on interviewer judgement to a great extent to classify whether a respondent was employed or 'out of the labour force', it is possible that some people were mis-classified when the PLFS was first rolled out, a senior ILO statistician said.[45]
Demographic 'fluctuations'
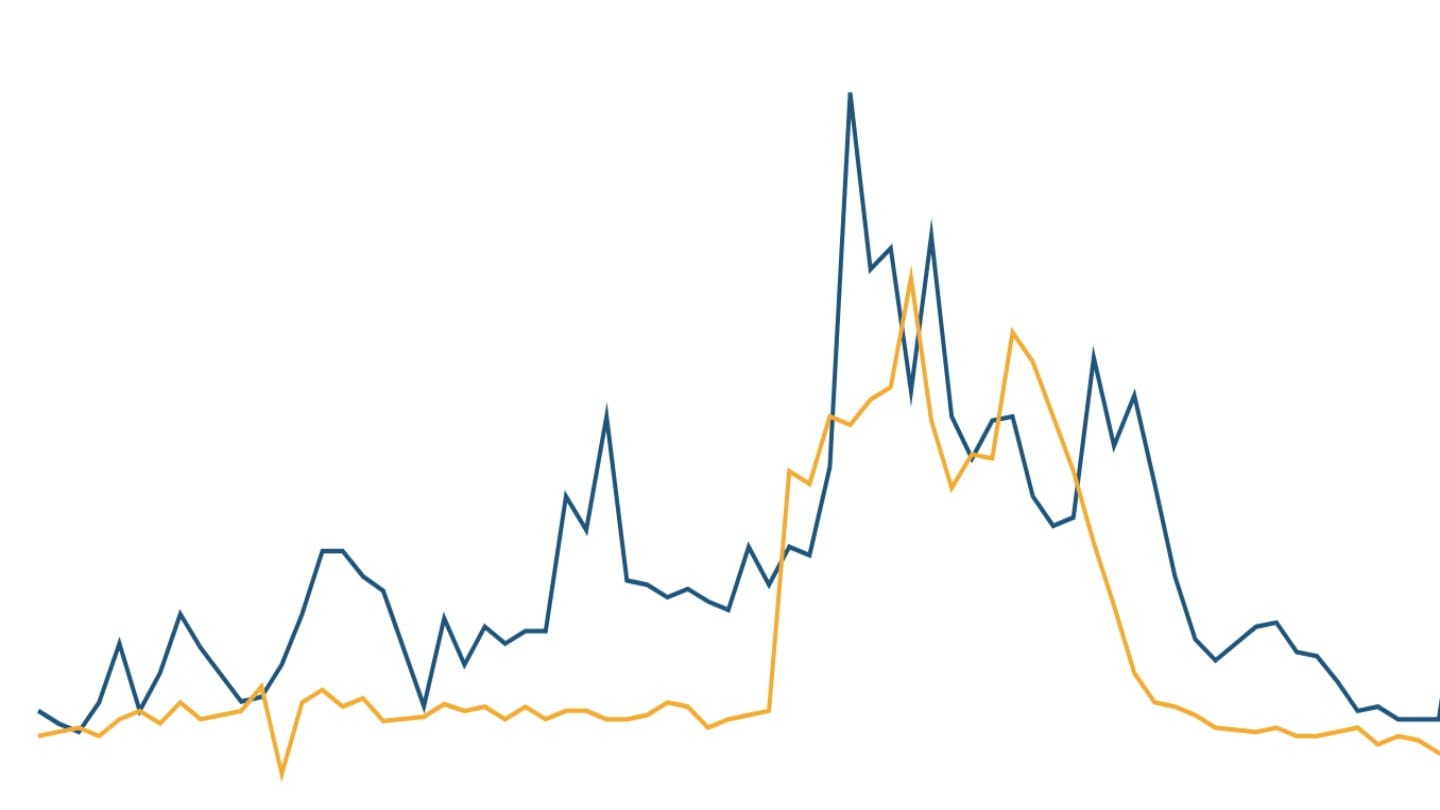
Finally, the PLFS 2022-23 round showed unusually large fluctuations in some key workforce and demographic parameters. A DFI investigation into this issue found that an erroneously large weight assigned to one village (FSU) in Assam had distorted the state's worker-population ratio, and caused the unusual fluctuations in the national worker-population ratio and sex ratio estimates. Earlier this year, the NSO acknowledged this issue in a technical clarification, warning data users to use that part of the dataset with caution. If we exclude the problematic FSU (treating it as an outlier) from that round, the fluctuations in the labour force and demographic parameters get ironed out.
[1] The Statistical Advisor to the Union cabinet and Planning Commission member, P.C. Mahalanobis, outlined the difficulties in applying global unemployment standards to India in his address at the 2nd All-India Labour Economics Conference held in January 1959; later republished in "Talks on Planning", Indian Statistical Institute (1961).
[2] Background paper for the workshop on conceptual issues in measurement of employment- unemployment (2009), P C Mohanan, NSC Secretariat.
[3] Review of Concepts and Measurement Techniques in Employment and Unemployment Surveys of NSSO (2008), Rajiv Mehta et al., Survey Design and Research Division (NSSO), MoSPI, Govt. of India.
[4] Led by the economist ML Dantwala, an expert committee was set up by the Planning Commission in 1968 to standardise employment measurement in the country. The Dantwala committee recommended the use of quarterly data - based on short recall periods - to analyse region-wise seasonal employment patterns and the use of 'usual status' data - based on long recall periods - to analyse long-term national trends. It also recommended separate estimation for different segments of the labour force by state, sex, age, rural-urban residence, worker status, and educational attainment. - Report of the Committee of Experts on Unemployment Estimates (1970), Dantwala et al., Planning Commission, Govt. of India.
[5] In 2009, the National Statistical Commission appointed a committee led by the economist Amitabh Kundu to outline a way forward for a 'periodic' labour force survey that would generate high-frequency data on employment conditions across the country.
The Kundu committee report, submitted in 2010, recommended a quarterly labour force survey for urban India, and annual updates for rural India. It also recommended pilot studies before the new survey was launched.
[6] The PLFS pilot began on 1 July 2011 in Himachal Pradesh, Odisha and Gujarat, and continued for two years till June 2013.
[7] Since 2025, PLFS survey rounds now follow a calendar year (Jan-Dec) cycle instead of the Jul-Jun cycle earlier.
[8] Districts within each state are arranged by population size. Those covering 95% of the state's urban population form one group, and the rest form another. In the first group, the rural and urban areas of each district form separate strata. In the second group, stratification occurs at the regional level (for a group of districts), with rural and urban strata in each NSS region spanning multiple districts. Further sub-stratification is done by village population (rural) and number of households (urban).
[9] In rural areas, three strata are formed: households with two or more members who have completed secondary (grade 10) or higher education, those with one such member, and those with no such members. In urban areas, an additional strata is formed for households that have three or more members who have completed their secondary education.
[10] Random sampling is a method of selecting a subset of units from a larger set, with each unit having an equal chance of being selected.
[11] For example, if a woman is employed for four months, unemployed for three months, and out of the labor force for five months in a reference year, she would be considered as part of the labour force since she was either working or looking for work as an unemployed person for the major part of the reference period (4+3=7 months). Since she was employed for most of that duration, she is considered a principal status worker.
[12] For example, if a woman is employed for three months, unemployed for four months, and out of the labour force for five months in a reference year, she is counted within the labour force for seven months, which is the major part of the year. Since she was employed for a minor part of that duration, she is considered a subsidiary status worker.
Subsidiary workers encompass part-time workers who may have a regular job elsewhere. Someone who works as a principal status worker in industry A may be considered as a subsidiary worker in industry B if she works for a couple of months in industry B.
[13] The sum of the employed and the unemployed constitute the labour force.
[14] This dual-track measurement system was developed on the basis of the Dantwala committee recommendations, and has remained broadly unchanged over the past five decades. The committee suggested the dual-track system because the Indian labour market is highly heterogeneous and subject to significant seasonal variations, especially in rural agrarian parts of the country. A single measure would either overlook under-employment or fail to distinguish between chronic and transitory unemployment. By tracking both long-term (usual status) and short-term (current weekly/daily status) estimates, policymakers would be able to gauge the chronic and seasonal components of unemployment in the country, the committee argued.
[15] Rotational panel sampling is a survey design where a part of the sample is retained and a part is systematically replaced in each round, blending cross-sectional and panel approaches to track changes over time.
[16] The revisit schedule records household characteristics including type and size of the household along with the monthly per capita consumption expenditure. It updates the list of erstwhile members and their ages, while recording the demographic particulars such as age, gender, marital status and educational status of new members. Further, it collects information on their daily activity status (up to a maximum of two activities) in the last one week, including details of industry and occupation categories, hours worked, earnings from wage or self-employment, and the hours they were available for additional work during the reference week.
[17] Since January 2025, the PLFS has used the rotational panel sampling scheme for both rural and urban areas. Each selected household is visited four times in four consecutive months-first with a detailed schedule, followed by three revisits with a truncated schedule. Every month, one-twelfth of the annual FSUs is newly surveyed, replacing the panel that has completed four visits. This design ensures a 75% overlap between consecutive monthly samples and 50% between consecutive quarterly samples, enabling uninterrupted monthly, quarterly and annual labour force estimates. After two years, the sampling frame is updated and a new panel is formed.
[18] Rotational panel sampling is used in labour force surveys in countries such as Australia, Canada, New Zealand, the United Kingdom and the United States of America because of its efficiency in increasing the precision of change estimates as compared to canvassing independent samples (which would entail much larger sample-sizes to ensure similar levels of precision).
[19] During the COVID-19 pandemic, the PLFS shifted to telephonic interviews for revisits as physical visits became difficult during lockdowns. Between 2020 and 2022, a significant proportion of revisits were completed through telephone surveys. Reluctance and non-response rates were higher in these interviews. Telephonic interviews were phased out in the 2023-24 round.
[20] India Employment Report (2024), International Labour Organization & Institute for Human Development.
[21] Education, Employment, and the Youth Labour Market in India (2024), Ravi Srivastava & Siddharth Dhote, Economic and Political Weekly.
[22] India's Growth and Employment Patterns: A Four-decade Perspective (2024), Alakh N Sharma & Balwant Singh Mehta, Economic and Political Weekly.
[23] State of Working India 2023: Social Identities and Labour Market Outcomes (2023), Amit Basole et al., Azim Premji University.
[24] India at Work: Employment Trends in the 21st Century (2025), Amaresh Dubey & Laveesh Bhandari, CESP Discussion Paper.
[25] India Employment Report (2024), International Labour Organization & Institute for Human Development.
[26] State of Working India 2023: Social Identities and Labour Market Outcomes (2023), Amit Basole et al., Azim Premji University.
[27] State of Working India 2023: Social Identities and Labour Market Outcomes (2023), Amit Basole et al., Azim Premji University.
[28] Refers to the short-term interest rates at which the central bank lends to, or borrows from, other financial institutions. These rates tend to influence interest rates for longer tenure loans in the economy.
[29] In each base-year revision since 1993-94, the informal sector estimates for the base year have been derived from surveys of informal enterprises and NSS labour force surveys. In a presentation earlier this year, NSO's national accounts team suggested that the earlier practice is likely to continue in the ongoing base revision exercise, with the PLFS replacing earlier NSS surveys, and the ASUSE replacing earlier informal sector surveys.
[30] Identification of Sample Units: Serious Issues with PLFS 2023-24 (2025), Panchanan Das, Economic and Political Weekly.
[31] Using the Rotational Panel Data from the Periodic Labour Force Survey: A Cautionary Tale (2021), Shihas Abdul Razak & Soham Sahoo, SSRN.
[32] Survey weights are numbers assigned to each sampled unit (such as a village/urban block, or household, or individuals) to indicate how many similar units in the population it represents. They are used to ensure that survey results reflect the size and composition of the population. If certain groups or areas are over-represented or under-represented in the sample, weights adjust their influence so that each group counts in proportion to its actual population share.
[33] Consistency in NSSO Employment-Unemployment Estimates Using NSS 68th Round and PLFS Data (2022), Jatinder S Bedi & Ajad Singh, Economic and Political Weekly.
[34] "For example, a poor man may cultivate his small piece of land, look after his animals, and then go out for hired, unskilled work. Or a woman in a rural household may collect water by walking to the common source of water; clean the animal shed, milk the animal, and feed it; and work at her own farm as a helper or go to an outside farm as a hired worker. A household survey is likely to net the main job (sometimes there are no main jobs, as there are many small jobs), and one or two secondary jobs. But it is not likely to net the small multiple jobs carried out for short durations as a hired worker, own-account worker, or family worker." - Understanding Women's Work Using Time-Use Statistics: The Case of India (2011), Hirway and Jose, Feminist Economics.
[35] Why is female labour force participation declining so sharply in India? (2014), Steven Kapsos et al., International Labour Office.
[36] Labor Markets in India: Measurement in Times of Structural Change (2024), Bhalla et al., ORF America.
[37] Why is female labour force participation declining so sharply in India? (2014), Steven Kapsos et al., International Labour Office.
[38] In the 61st round (2004-05), a minimum of 30 days of work in the reference year was made mandatory for categorising a person as a subsidiary worker. Desai and Joshi (2019) argue that women's work is increasingly fragmented and contingent. For example, if a woman spends 10 days as a farm labourer, a few months later 10 days in MGNREGA, and during the harvesting season 20 days on the family farm, she should be classified as a worker under the NSSO subsidiary status definition. However, this may be missed if NSSO interviewers do not probe beyond simply asking, "Did you work for at least 30 days in any economic activity?" - The Paradox of Declining Female Work Participation in an Era of Economic Growth (2019), Sonalde Desai & Omkar Joshi, The Indian Journal of Labour Economics.
[39] Usual status workers excluding those who worked as helpers in household enterprises (unpaid family workers).
[40] Hirway and Jose (2011) showed that TUS-based workforce participation rates for women, calculated using the CWS criterion, were above 1.5 times the EUS estimates. - Understanding Women's Work Using Time-Use Statistics: The Case of India (2011), Hirway and Jose, Feminist Economics.
[41] Measuring Work: Comparing Employment-Unemployment Surveys with Time Use Surveys (2021), PC Mohanan, Centre for Economic Data and Analysis (CEDA), Ashoka University.
[42] Labor Markets in India: Measurement in Times of Structural Change (2024), Bhalla et al., ORF America.
[43] The ILO's modelled estimates combine nationally reported observations with imputed values from econometric models to fill data gaps. This creates a balanced global dataset with consistent country coverage each year, allowing the ILO to generate comparable national, regional, and global labour market indicators and analyse related trends, even where country data are incomplete.
[44] India at Work: Employment Trends in the 21st Century (2025), Amaresh Dubey & Laveesh Bhandari, CESP Discussion Paper.
[45] "When a survey departs from international standards and depends heavily on interviewer judgment, the results may not be comparable, even if the survey questions themselves have not changed significantly," a Geneva-based senior ILO statistician wrote in an emailed response to DFI's queries about the modelled estimates. "… A detailed analysis, which ideally includes information on how interviewer judgment was applied and the instructions given to interviewers, would be needed to make firm claims about comparability."