Measuring how many people in a country are poor, and how that has changed over time, is crucial to understanding a country and its economic trajectory. To do this, countries and institutions set poverty lines - levels of income or expenditure needed to afford basic goods and services, with people falling below them considered poor.
The World Bank sets poverty lines that help track and compare the levels of poverty in countries across the world. In this piece we look at poverty in India as measured by the World Bank. The World Bank estimates that the rate of poverty in India declined from one in two people in the 1970s to one in twenty people by 2022.
What share of Indians does the World Bank estimate are poor?
The World Bank's most recent (June 2025) poverty lines are at three levels, each representative of median poverty in three different economic groups of countries.[1]
Since price levels are different across countries, the Bank expresses its poverty lines using a common currency that can be converted to national currency through what are known as purchasing power parities (PPPs). (See the methodology section for more.)
The median of the national poverty lines of low-income countries is known as the International Poverty Line, and it defines the threshold for extreme poverty for the world. In June 2025, it was set at $3.00 per day per person in 2021 PPP terms.[2]
The median of the national poverty lines of lower-middle-income countries is the LMIC poverty line, set at $4.20 per day per person in 2021 PPP terms. India is a lower- middle-income country according to the World Bank's classification.
Finally, there is the upper-middle-income (UMIC) poverty line at $8.30 per day per person in 2021 PPP terms.
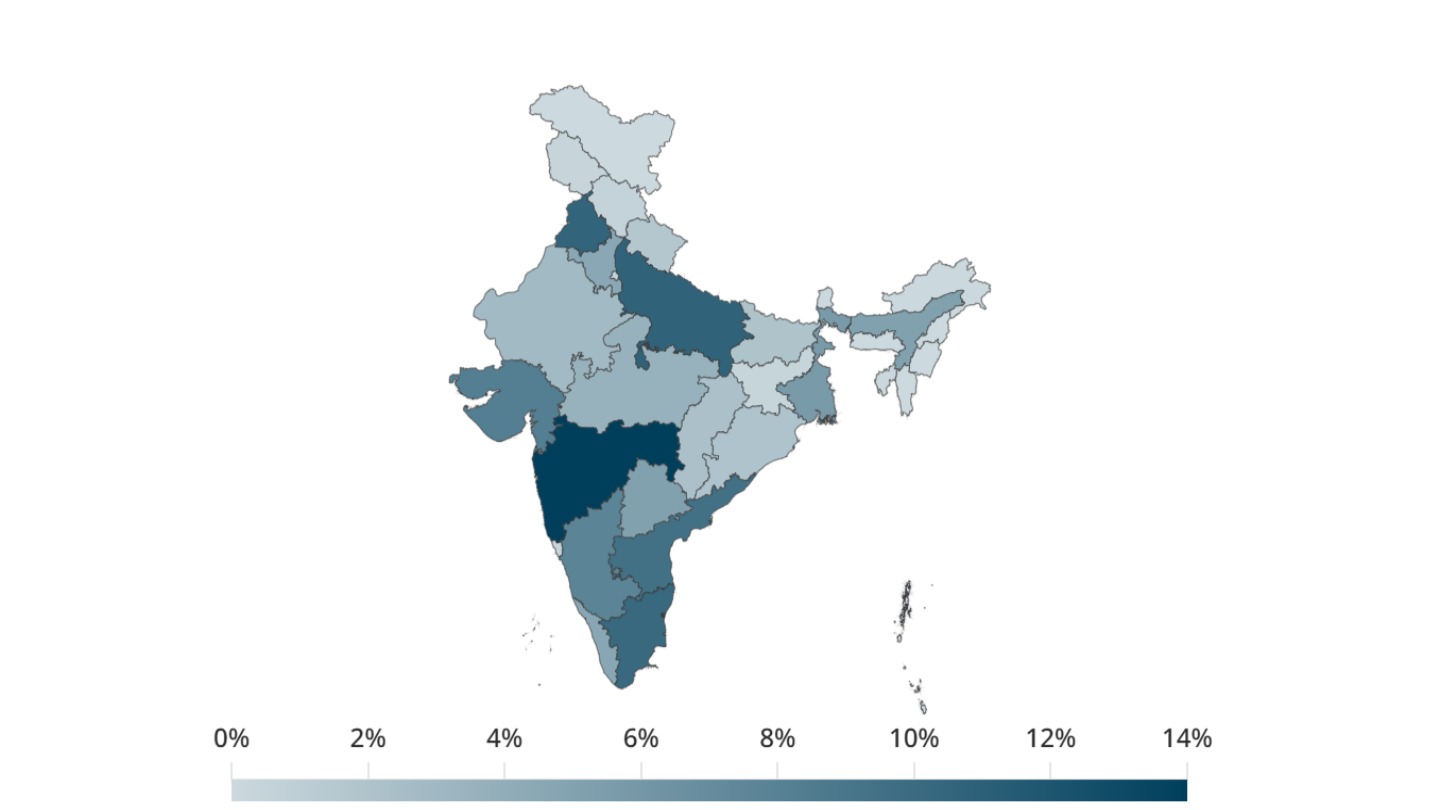
Using these poverty lines, the World Bank finds that 5.3% of India's population falls below the extreme poverty line threshold of $3 per day (PPP). In other words, one in twenty Indians live in extreme poverty. In India's national currency, the $3 (PPP) per day threshold corresponds to ₹60 per person per day.
India's poverty rate declined at regular intervals in the past, but it reduced at the fastest pace after 2004 with accelerated economic growth. More than a quarter of India's population lived in extreme poverty in 2011, while the majority was extremely poor in 1977.
Since India is a lower-middle-income country, poverty estimates under the LMIC poverty line of $4.20 per day (2021 PPP) are considered more appropriate for the country. At the LMIC poverty line, 24% of India's population or nearly one in four Indians were poor in 2022.[3] The LMIC poverty line corresponds to consumption expenditure of roughly ₹84 per person per day.
If the yardstick of the standard of living of the poorest in upper-middle-income countries (UMIC) were to be applied, more than 80% of Indians would live below that poverty line. The UMIC poverty line represents poverty levels in countries such as China, Mexico, Indonesia, and South Africa.
How does poverty in India compare with other countries?
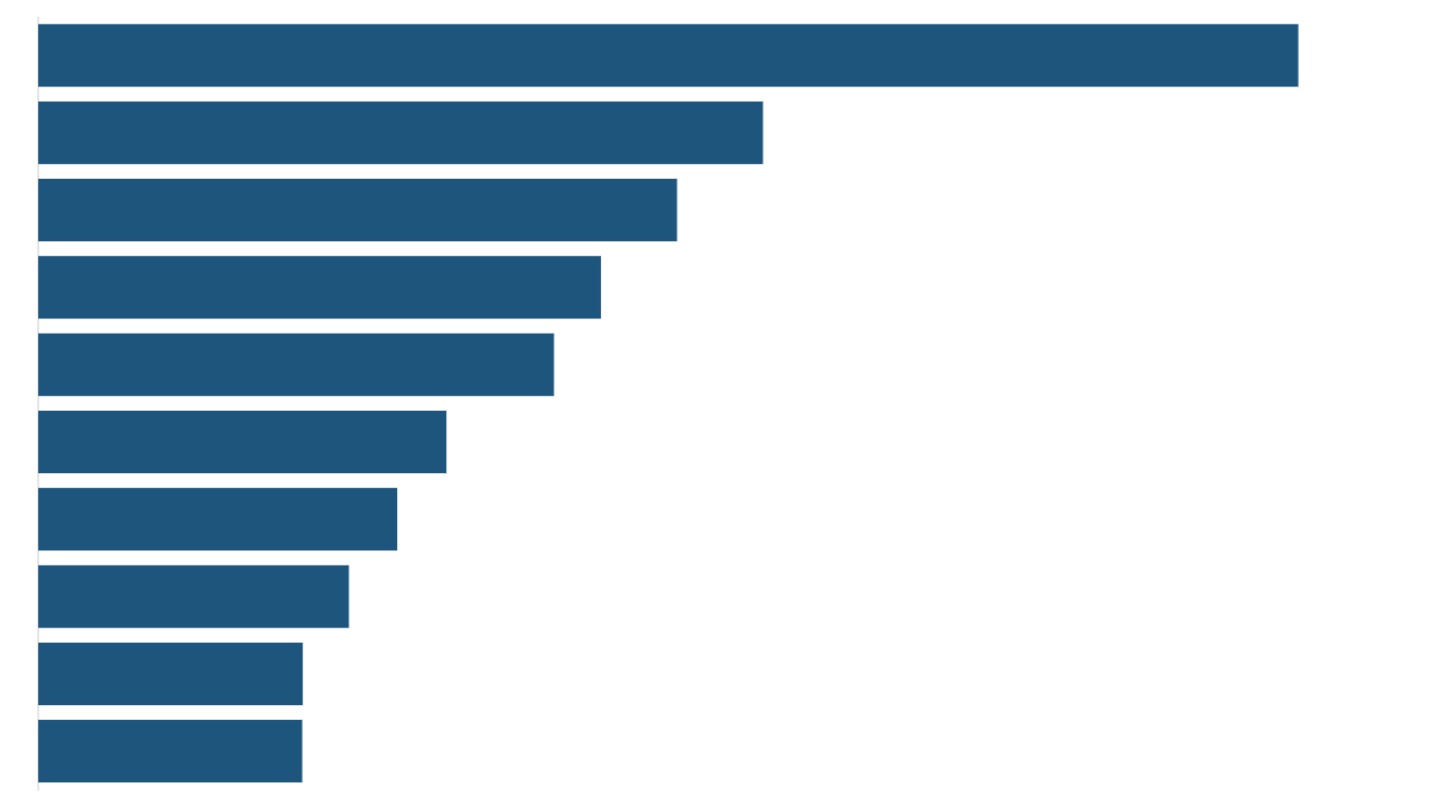
The extreme poverty rate in India is now lower than the world[4] on average - 10.8% of the world's population lives in extreme poverty, as compared to 5.3% in India. This is the first time that India's poverty rate is lower than the global average.
Bangladesh's poverty rate is similar to India's (5.9%), but China and Vietnam are reported to have eradicated extreme poverty.
At the lower-middle-income poverty line, which is more relevant to India, its poverty rate is still higher than the world average.
The rate of reduction of extreme poverty in India has been slower than that of China and Vietnam, but faster than developing African countries such as Nigeria and Kenya.
China's extreme and LMIC poverty rates were higher than that of India until the 2000s. By 2020, it had not only managed to eradicate extreme poverty, but also lifted the entire country out of poverty at the LMIC level.
At the upper-middle-income poverty line of $8.3 per day (2021 PPP), four in five Indians are poor, while only one in five persons in China and Viet Nam are.
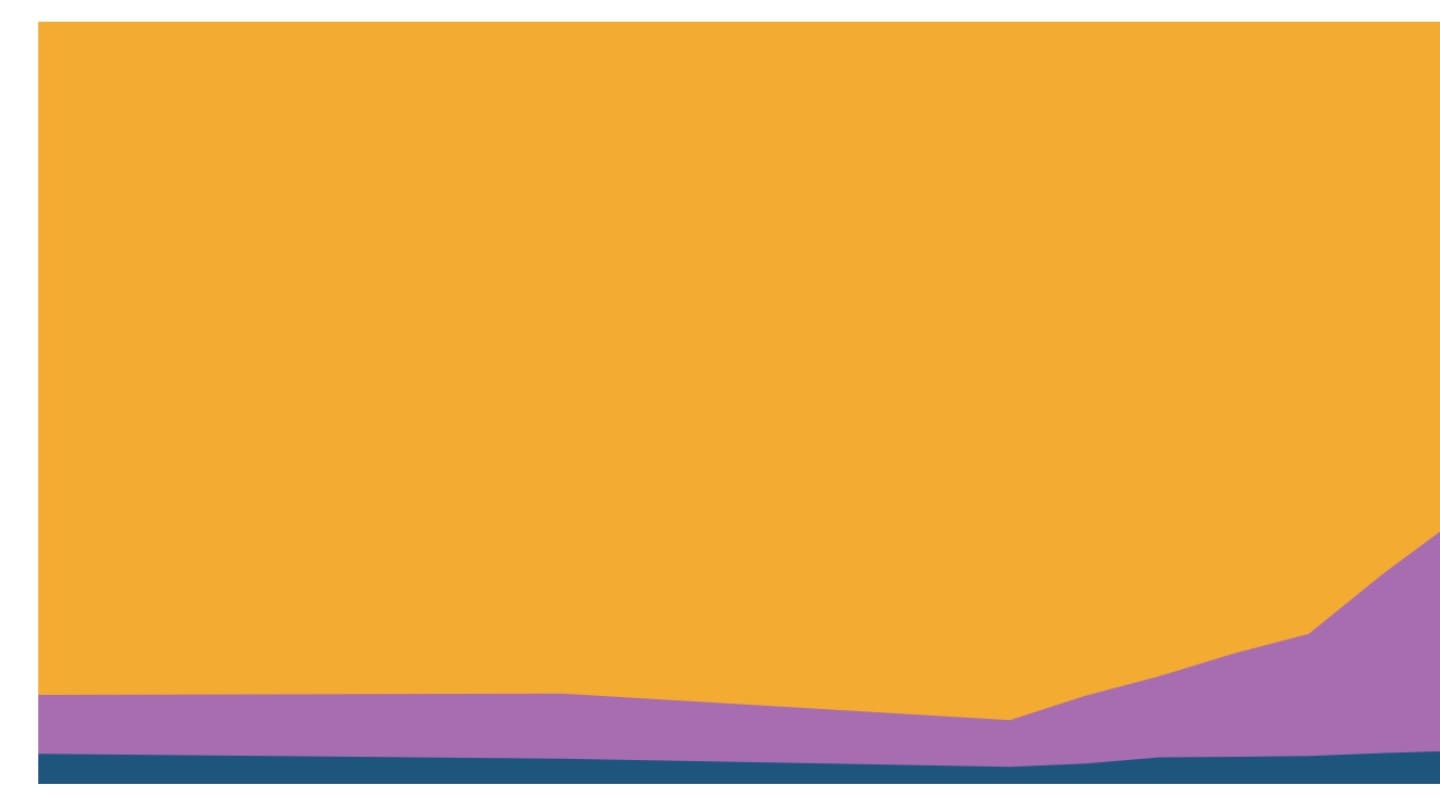
What this suggests is while relatively few people in India now live in extreme poverty, the majority of the rest are not very rich either, and live in conditions that would be considered poverty in lower-middle or upper-middle-income countries. In the rest of the world, on the other hand, a significant share of the population, particularly in the African continent, live in extreme poverty. Global extreme poverty is concentrated in Sub-Saharan Africa, but South Asia occupies a large share of the poor when poverty is measured at middle-income levels. In the rest of the world, most people live in relative comfort.
How many people in India does the World Bank count as poor?
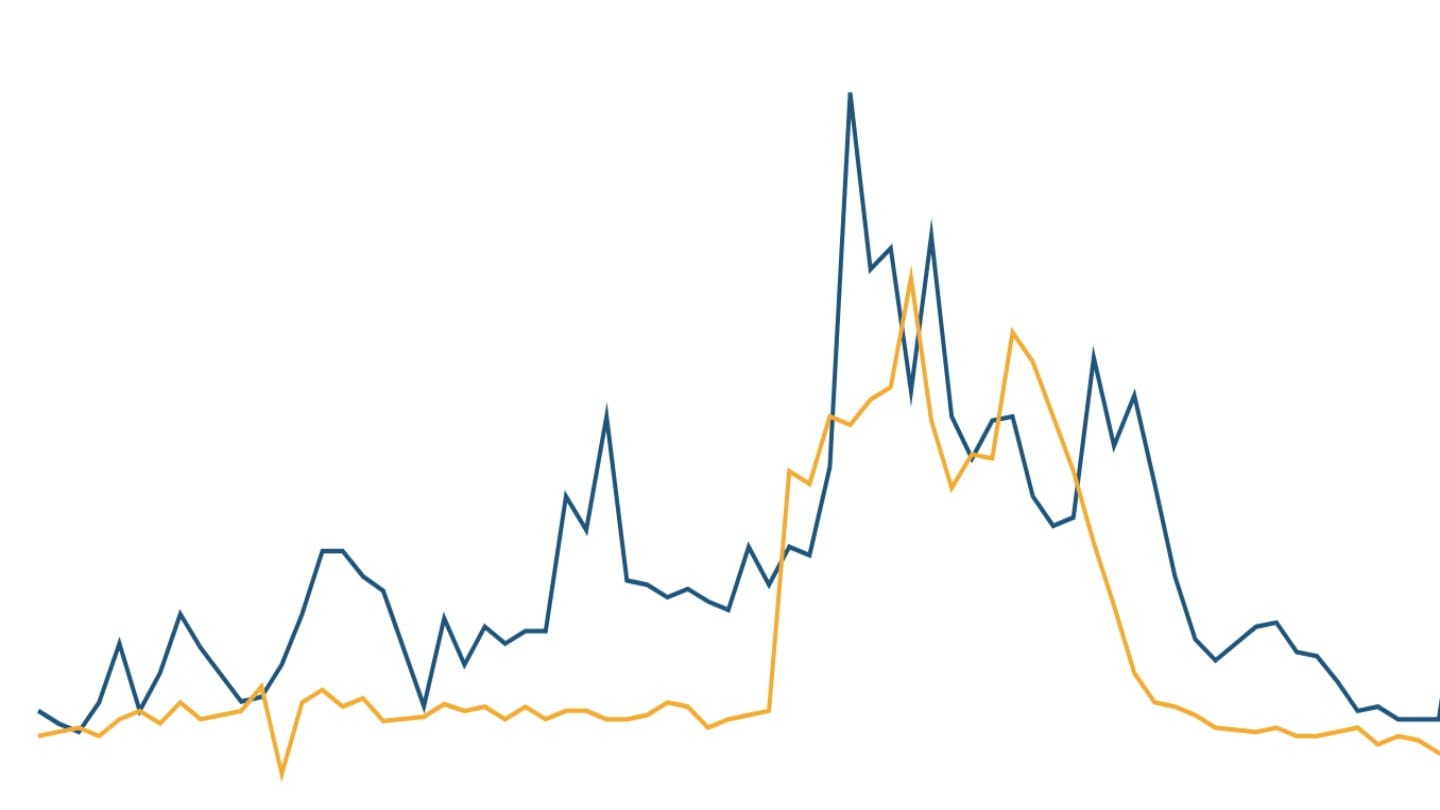
Even though India's poverty rate has steadily declined over time, the absolute number of people living in poverty in India increased up to the 2000s to reach around 530 million, and reduced sharply thereafter. About 75 million Indians lived in extreme poverty in 2022.
This is as a result of population growth dynamics. The 1970s saw India's population grow at the fastest rate recorded since Independence. But in the same period, Indians experienced low rates of economic growth.
The share of India in extreme poverty across the world has declined from 27% in the 2000s to about 9% in 2022.
Prior to the 2000s, India had more poor people than in Sub-Saharan Africa. With a decline in India's poverty and a rise in poverty among the countries in Sub-Saharan Africa, global poverty is more concentrated in the latter today.
Using the LMIC poverty line, close to 350 million Indians would be categorised as poor at the standards of living of lower-middle-income countries like India. Using the UMIC poverty line on the other hand, a little more than 1.15 billion people in India would fall below the poverty line.
How the World Bank estimates poverty
Every few years, many countries construct their own national poverty lines. Using these, they measure poverty at the domestic level.
However, since national poverty lines are expressed in national currencies, and reflect prices and living standards in a particular country, they are unsuited to make cross-country comparisons. Market-based exchange rates between national currencies do not help here, as the prices of goods and services vary substantially between countries. For instance, US $1 may convert to Rs 90 in Indian Rupees in the market, but it does not mean that something that costs US $1 in the US could be bought at Rs 90 in India.
The International Comparison Programme (ICP) at the World Bank calculates PPPs by selecting a pre-defined basket of goods, services and benefits in a country, and determining the amount that a household in that country needs to spend to buy it. Using the US dollar as the base currency, it then creates conversion factors for currencies of all countries.
For example, let us assume that a basket of daily needs costs $100 in the United States, and Rs 2000 in India. If we use the US dollar as the benchmark ($1 PPP = US $1), it would mean that what can be bought in $1 PPP in the US could be bought in Rs 20 in India. The PPP conversion factor for India, then, is 20. This is different from the market-based currency exchange rate.
The World Bank constructs internationally comparable poverty lines every few years to allow for global comparisons. The Bank started measuring poverty in the 1980s, and it constructed its first global poverty line of $1 per day in 1990.[5] It has since revised the poverty lines on multiple occasions to adapt with changing economic realities.
To estimate poverty, the Bank first constructs global poverty lines by taking the median of national poverty lines, and converting them into PPPs.
As of June 2025, the Bank has three poverty lines - the median of the national poverty lines of low-income countries (International Poverty Line, capturing extreme poverty), the median of the national poverty lines of lower-middle-income countries (LMIC poverty line) and the median of the national poverty lines of upper-middle-income countries (UMIC poverty line).
Once the poverty line has been drawn, the Bank must estimate how many people in a country live below that line at a given time.
For this, the Bank uses data from a national household income or consumption expenditure survey in that country conducted close to the PPP base year. The latest available PPPs currently are for 2021.
Since each country measures income or consumption at different points in time, it must normalise the levels of consumption at those points in time to the prices prevalent at a fixed point in time; in this case, the PPP base year 2021, to be able to use the PPPs. For instance, country A's consumption survey may be conducted in 2022 while that of country B may be conducted in 2023. To make the income measure of both countries' comparable, it first needs to be for the same period (base year 2021) before it is converted to a common currency using PPPs of that year. This "deflation" of income/consumption in 2022/2023 to the prices prevalent in 2021 (or inflating the measure if the survey was conducted before 2021) is done using the national consumer price indexes in the respective country.
Once the distribution of households by their monetary economic well-being is obtained for 2021 prices and is converted to PPPs, the threshold of the global poverty line is applied. The share of the population that falls below the threshold is the poverty rate, or the poverty headcount ratio for that country.
How the poverty rate for India is calculated
India constructed national poverty lines on multiple occasions, from the 1970s to the 2010s. The most recent national poverty line was announced in 2014, and was applied to data from 2011-12. According to India's national poverty line, nearly 30%, or at least a third of India's population lived in poverty in 2011-12.
Since 2014, India has not had a poverty line. As a result, the World Bank's current global poverty lines are computed without a poverty line from India.
The World Bank, however, estimates the poverty rate for India using its international poverty lines.
India's National Statistics Office conducted the nationally representative Household Consumption Expenditure Survey in 2022-23 after a gap of eleven years. The HCES records all monetary spending on domestic consumption and measures the value of the subsidised goods consumed by them.
The World Bank converted the cost of the pre-defined basket of goods and services (the "welfare aggregate") from the prices prevalent at the time of the HCES survey to 2021 prices using India's consumer price index. That adjusted cost was then expressed in a common currency using 2021 PPPs.[6]
This gave the distribution of Indian households by PPP-adjusted real consumption expenditure, to which the global poverty lines were applied to generate a poverty headcount ratio.
[1] June 2025 Update to the Poverty and Inequality Platform (PIP) (2025), Federica Alfani, Danielle V. Aron et. al., World Bank Group.
[2] The current IPL is the median of the national poverty lines of the 23 poorest countries in the world. The construction of a global poverty line from national poverty lines has been a topic of intense public debate, and was pioneered by Martin Ravallion and others since the 1990s.
[3] The LMIC poverty line ($4.20 at 2021 PPP) is based on national poverty lines that are less recent than the other lines (IPL and UMIC lines). The LMIC line would likely be higher if more timely data were available for lower-middle-income countries. "Global Poverty Revisited Using 2021 PPPs and New Data on Consumption" (2025), Elizabeth Foster, Dean Jolliffe, Gabriel Lara Ibarra, Christoph Lakner, Samuel Tetteh-Baah, World Bank Group.
[4] The World Bank releases forecasts of poverty rates for regions (such as Latin America) and the world using statistical modelling of data. For regions, nowcasts are made if recent survey data (three years before or after) is available for countries that represent at least 50% of the region's population. Global nowcasts are made if recent survey data is available for countries that represent 50% or more of the population in low and lower-middle-income countries, in addition to the previous condition. The data for 2024 and 2025 mentioned in the hyperlinked report are nowcasts.
[5] It was based on household survey data for 22 countries done by Ravallion et. al. In 2009, Ravallion and others published another study that put the then International Poverty Line at $1.25 per day, which was the average of the 15 poorest countries of the 75-country dataset they worked on.
[6] The World Bank's new methodology of measurement of household consumption in India is detailed in the document, "India: Trends in Poverty, 2011-12 to 2022-23 Methodology Note" (2025), World Bank Group