About the website
How is the content on the website organised?
chevron_forward
The Data For India website has eight verticals: Population, Health, Economy, Living Conditions, Work, Law, Climate and Measurement. All our work is organised under these verticals.
You can also find a collection of all topics covered under each theme in the navigation menu and the "Explore all topics" section at the bottom of our homepage.
How can I search for an article or chart on the website?
chevron_forward
You can use the semantic search functionality available on the Data For India website from the home page, or at the top right corner of every page of the website to search for any of our published work, across key themes, specific topics of your interest or by authors in our team.
How can I see the data behind a chart?
chevron_forward
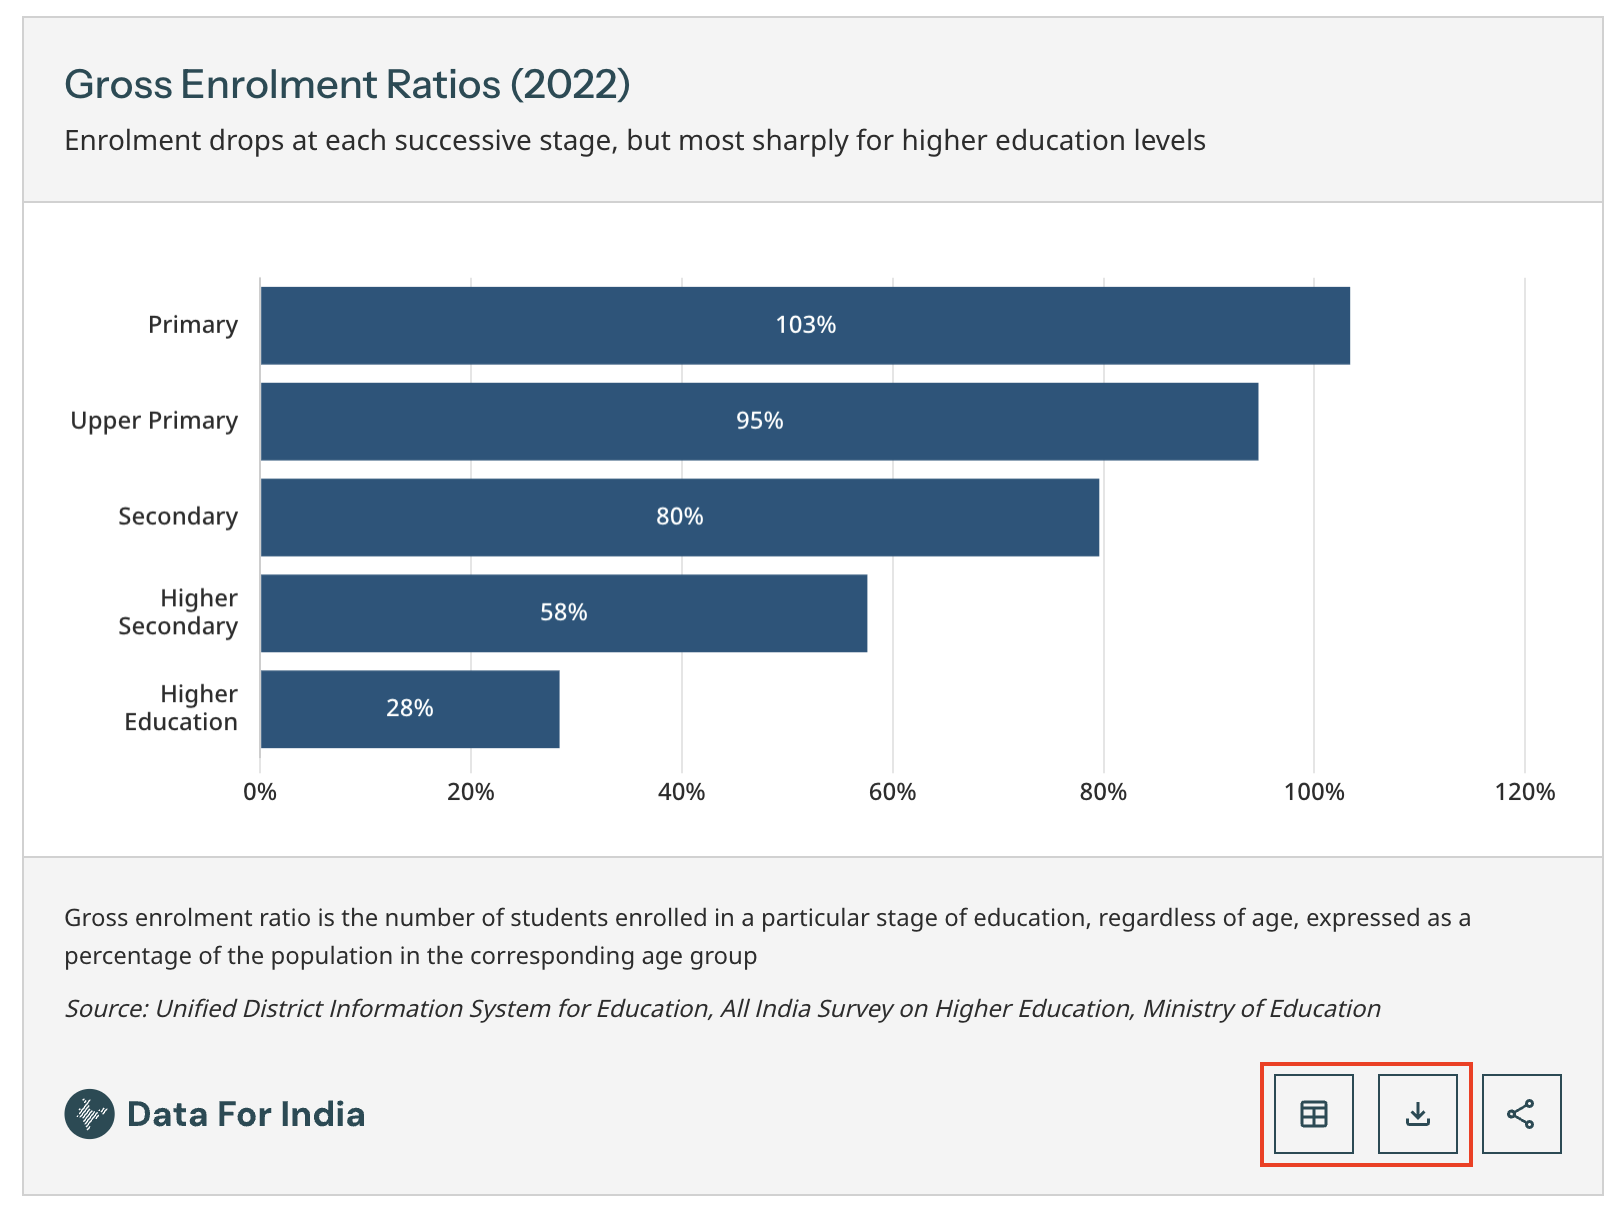
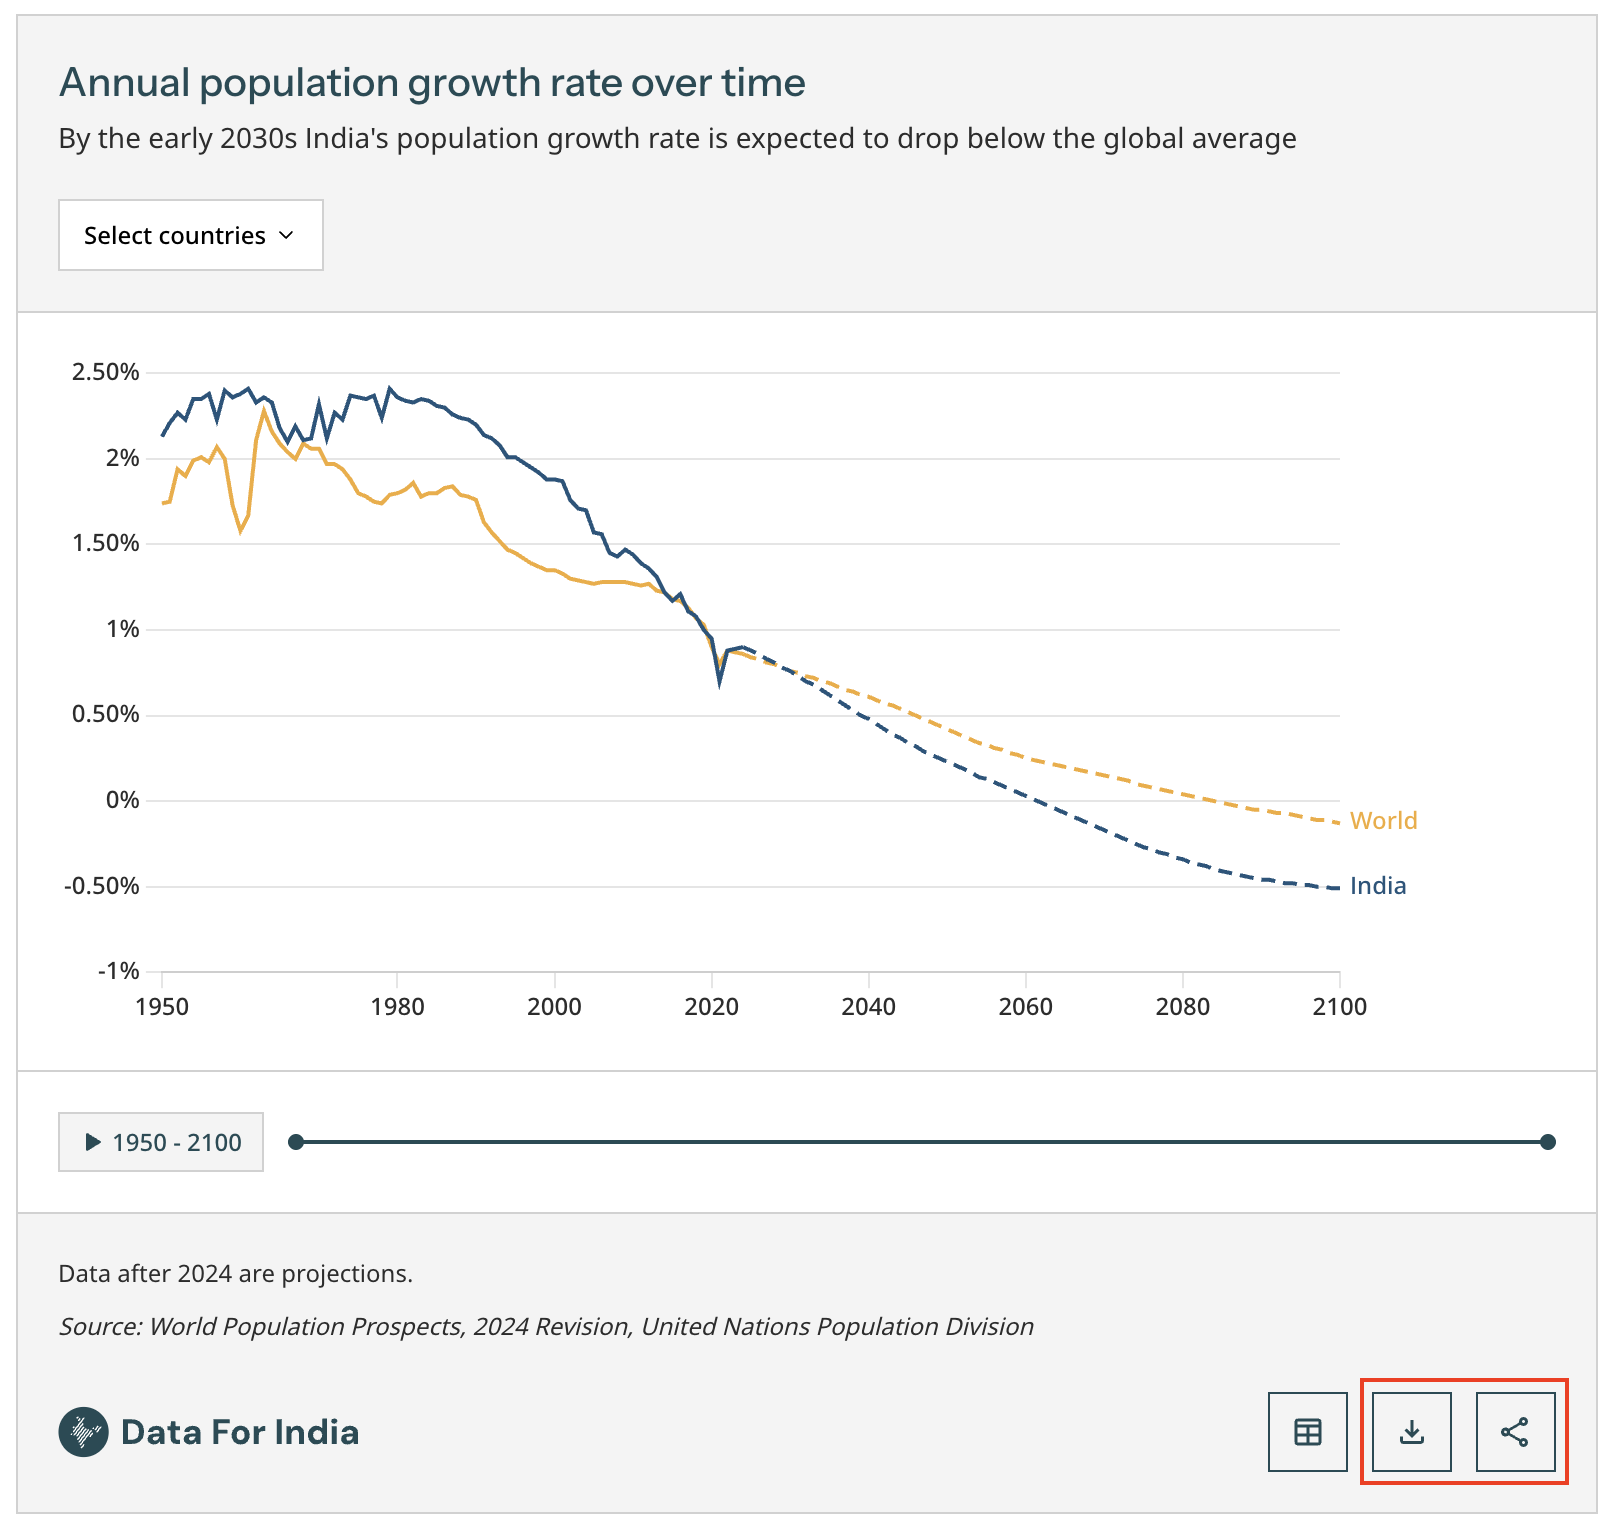
Every chart on the Data For India website contains a menu of options at the bottom right corner which includes:
- A toggle button that lets you switch between chart and table view
- An option to download either the data selected on the chart view using "Download Chart Data", or all
of the data behind a particular chart using "Download Full Data", in
.csvformat
How can I create custom charts on your website?
chevron_forward
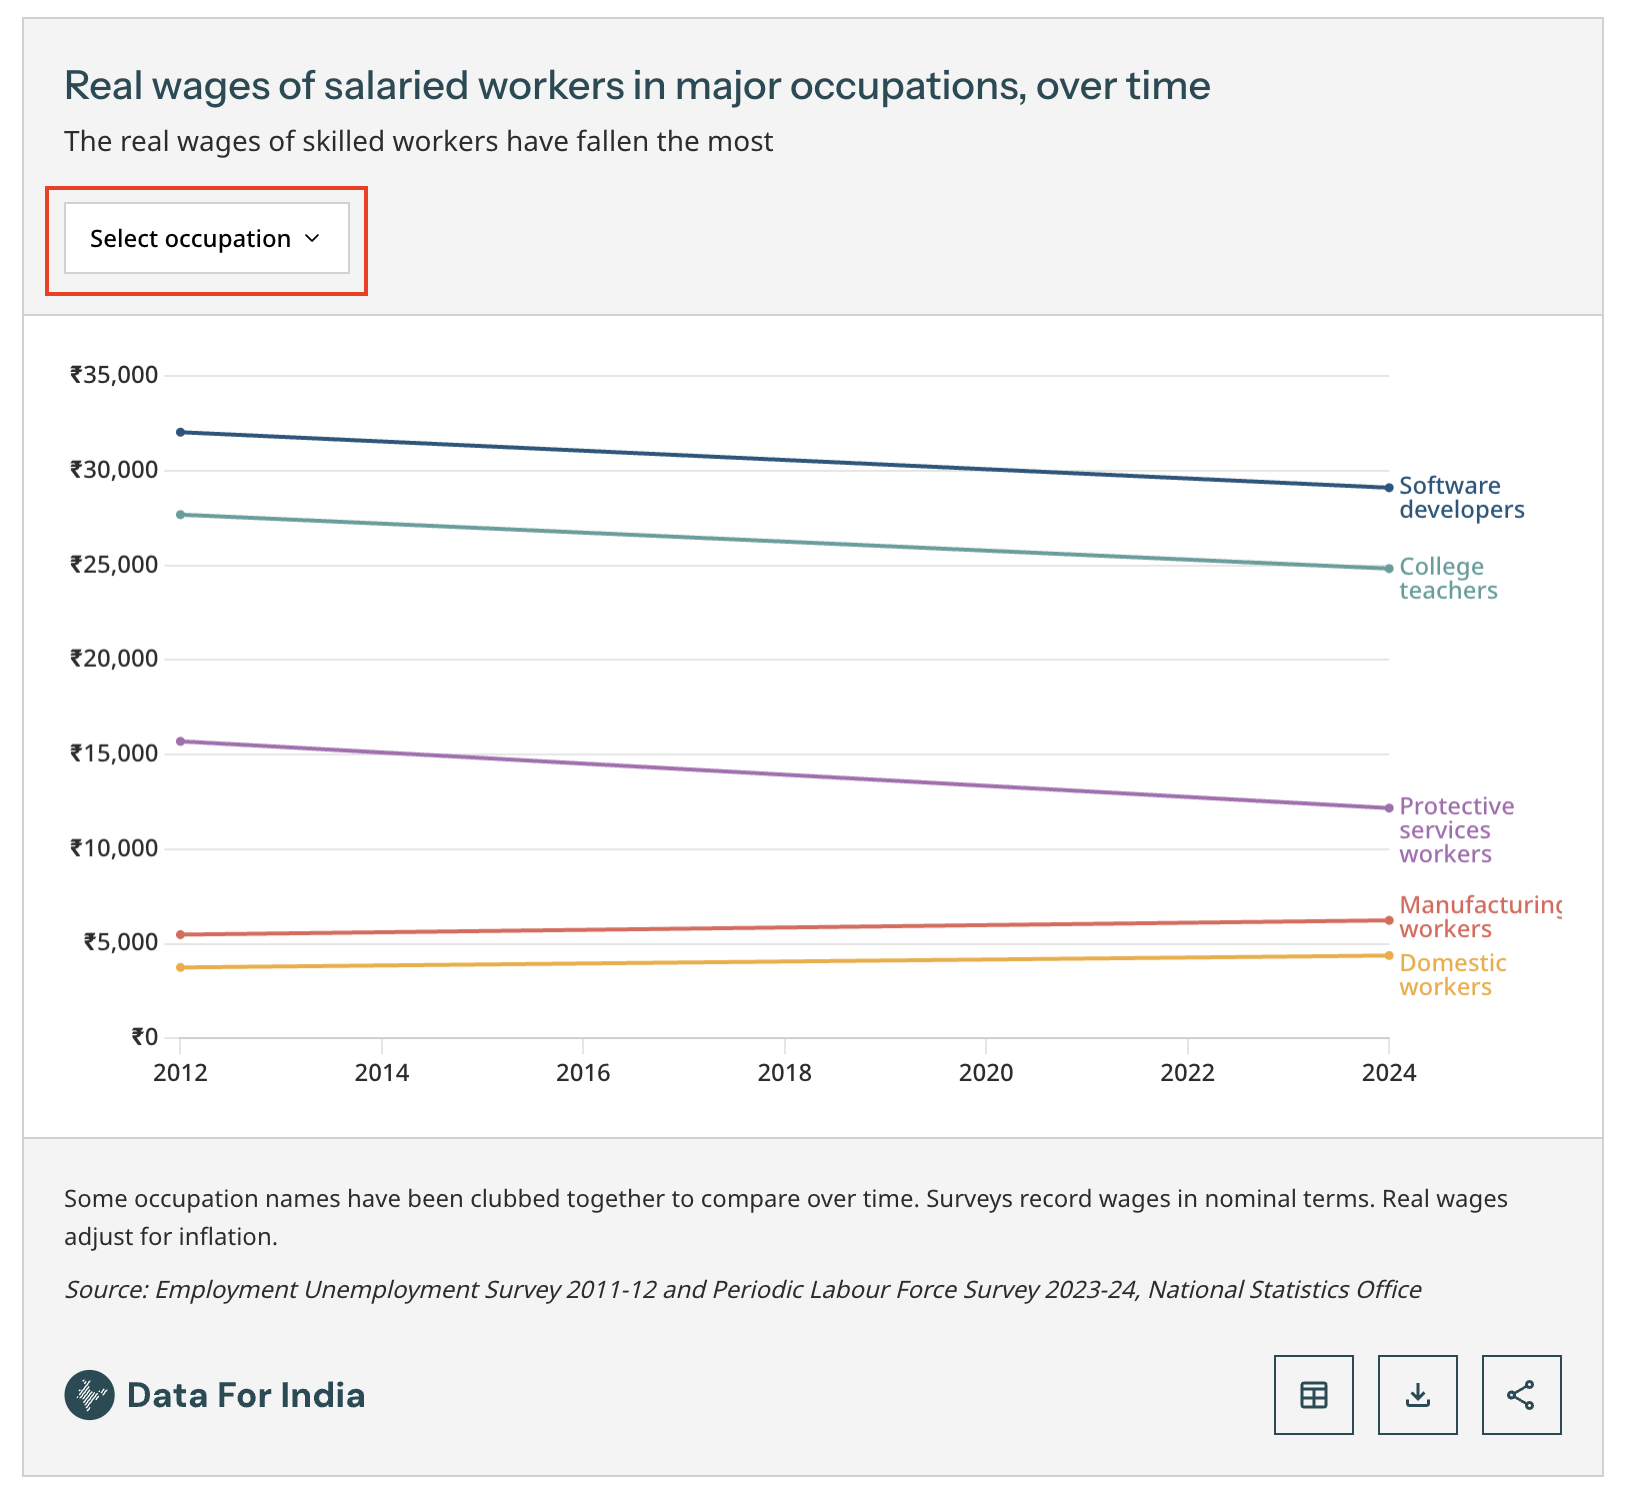
Currently, you cannot create custom charts on the Data For India website. You can only customise the view for the existing charts by changing the current selection filter, wherever the option is made available at the top of the chart.
Many of the charts already published on the website provide you with the options to search or change the geographical region, period of time, or particular indicator that you might be interested in.
You can share the chart as a downloaded chart image from our site and upload it in your work, or use a link, or embed the chart image. For online publications, we encourage you to embed our charts so that interactivity is retained.
How do you make decisions on what topics are covered?
chevron_forward
Data For India aims to be a knowledge resource for readers to be able to answer fundamental questions that they may have about socio-economic issues in India, and our choice of topics reflects these aims.
If there is an area of knowledge you would like to see that is not currently on Data For India, please write to us at info@dataforindia.com and we will consider your suggestions.
Do you update the articles published on the website?
chevron_forward
Data For India articles aim to be living documents, and we periodically review our work to incorporate newer data and research. Every piece of writing on the website has a time-stamp for the date of publication and for updates. If a piece has been substantially updated, we mark it at the beginning of the piece.
Do you have a newsletter?
chevron_forward
Yes, Data For India publishes two newsletters:
- "The Big Shift", written by our founder Rukmini S, is a weekly newsletter examining India’s long-term transformation through the lens of data.
- “The Roundup” is our monthly newsletter covering the latest work, new platform features and key updates from Data For India.
You can subscribe to the newsletters here.
How do I stay updated with your latest work?
chevron_forward
You can subscribe to Data For India's newsletters here, and follow us on all major social media platforms like Instagram, Linkedin, X (Twitter), Threads and Bluesky.
How can I trust your work?
chevron_forward
All of Data For India's work mentions the sources of data used and the methodology, and we follow rigorous internal processes to ensure accuracy. We encourage readers to look at the original data sources, and/or use the data for their own work. If you find an error in our work, please contact us at info@dataforindia.com.
Using Data For India's work
How is your work licensed?
chevron_forward
Data For India's work is meant to be shared and used widely. Our articles and charts are published under the Creative Commons Attribution 4.0 License (CC-BY 4.0) and can be freely shared. You do not need to seek our permission to reuse our work; you just need to provide credit to Data For India and link to the original work on our site.
What are the ways in which I can reuse your work?
chevron_forward
You can freely cite Data For India’s articles as a source of information, or quote directly from them. You can republish the articles in print or online, provided that you use the full citation and link, and do not imply that we are contributors to your publication.
Please do not attribute any additional words that were not written by us to Data For India, either in text, headlines or on social media.
You can also use our charts as static images, embeds or links in your work, as long as you do not edit them. To know more about our citation guidelines, please check the using our work page.
How can I use the charts on your website?
chevron_forward
You can use Data For India’s charts as static images, embeds or links in your work, as long as you do not edit them. You could download the chart image from our site and upload it in your work, or use a link, or embed the chart image. For online publications, we encourage you to embed our charts so that interactivity is retained.
Can I translate your work into another language?
chevron_forward
For India welcomes translations of our original work, subject to the following:
- Please do share your translations with us for our review
- We will endorse it depending on our ability to review the translation
All translations must include the following statement: "This is a translation of the original work, produced by [your name]. It is not an official translation by Data For India or the original authors."
Please include a link to the original work following our citation guidelines.
Example of a translation previously reviewed by Data For India: भारत में स्वरोज़गार: मर्ज़ी या मजबूरी? by Puliyabaazi
About the data
What are your data sources?
chevron_forward
Data For India uses public data produced by the Indian national government, and public data from select multilateral agencies. Specifically, this includes the following datasets:
Indian government:
- The Indian Census and its projections
- The National Sample Surveys from the National Statistics Office
- The National Family Health Surveys
- The Sample Registration System and the Civil Registration System of the Office of the Registrar General of India
- Administrative data from national ministries and regulators, typically accessed via the National Data Analytics Platform
- The National Crime Records Bureau
- The e-courts platform for legal data
- The Indian Meteorological Department
Multilateral agencies:
- World Bank World Development Indicators
- United Nations World Population Prospects
- World Health Organization data
- International Labour Organization data
- The Institute for Health Metrics and Evaluation in limited cases
We do not use data produced by private surveyors, think-tanks and NGOs, whether Indian or international, or by Indian state governments. This is to ensure that the data we use is methodologically rigorous, transparent in its methods, overseen by relevant experts, and public, meaning that it can be verified. It also allows us to be a citable resource for students and academia.
What is your data verification process?
chevron_forward
Data For India works only with data from the sources listed above. Wherever possible, we work with raw data from the publication source, and use the published aggregates to recheck our findings. We do not alter the data or indicators in the raw data. We follow established statistical norms while working with the data.
How can I get access to your data?
chevron_forward
Every chart on the Data For India website contains a menu of options at the bottom right corner which includes:
- A toggle button that lets you switch between chart and table view
- An option to download either the data selected on the chart view using "Download Chart Data", or all
of the data behind a particular chart using "Download Full Data", in
.csvformat
How can I understand the steps taken by you to process the raw data?
chevron_forward
Data For India works with raw data from the publication source, and uses the published aggregates to recheck our findings. We do not alter the data or indicators in the raw data, and follow established statistical norms while working with the data. If any data is aggregated or renamed for ease of understanding, we state as such in the text, footnotes or chart notes.
For any topics or data sources that require a deeper explanation, Data For India publishes articles under the Measurement vertical explaining the methodology and our decision making process around the data.
About the technology
What tools do you use to run the website?
chevron_forward
Data For India's website is built on the Ghost platform, with search driven by Typesense and interactive charts created using the ECharts library.
What tools do you use to create the charts?
chevron_forward
Data For India uses an open source JavaScript visualisation library ECharts for creating its interactive charts.
Do you provide an API to access the data available on the
platform?
chevron_forward
Data For India does not provide any APIs at the moment. The datasets linked to charts can be downloaded using the options available within the share menu on each chart.
About the company
How is your work funded?
chevron_forward
Data For India is a private limited company registered in Chennai, India, in June 2023. We fund our work by doing paid data analysis and consulting for think-tanks, universities and private firms. Contact us at info@dataforindia.com if you would like to know more about our business offerings.
How can I attend events organised by you?
chevron_forward
Data For India makes announcements about upcoming events on our social media accounts and to our subscribers via email. Subscribe to Data For India to get updates on any future events.
Contributing to Data For India
How can I become a contributing writer?
chevron_forward
Data For India thanks you for your interest, but we do not currently accept work from non-staffers.
How can I contribute my research data to the website?
chevron_forward
Data For India uses only public data produced by the Indian government and multilateral agencies. However, if you have put together a dataset that you think might be useful for us to look at, please contact us at info@dataforindia.com.
Do you have any job openings?
chevron_forward
Data For India posts job openings on our social media platforms, including LinkedIn.