In the very first edition of this newsletter, I tried to explain why we were starting it, with these words:
The reason we don’t see that much of the long view is not just that memories are short and that media incentives are better aligned to discussing the most recent data. It’s also that historical data can be hard to put together… At Data For India, a lot of our research and data work goes into creating such time series, all from public data.
Nowhere has this been more true than when it comes to data on the economies of Indian states. What The Big Shift would like to do is simply pick up data points that show the change in the size and distribution of the economies of Indian states over time. What I'm going to do instead in this edition is talk a little about why that's next to impossible, and to hope that that changes.
While looking at this data for his piece for us, my colleague Abhishek Waghmare found that state domestic product data is available from the 1970s, but not in a uniform and comparable time series. "Every few years, a new and better methodology replaces the older one, similar to the rebasing of the national accounts series," he writes. "Unlike in the case of the national accounts series, there is no official linking factor for states that could be used to compute a consistent time series."
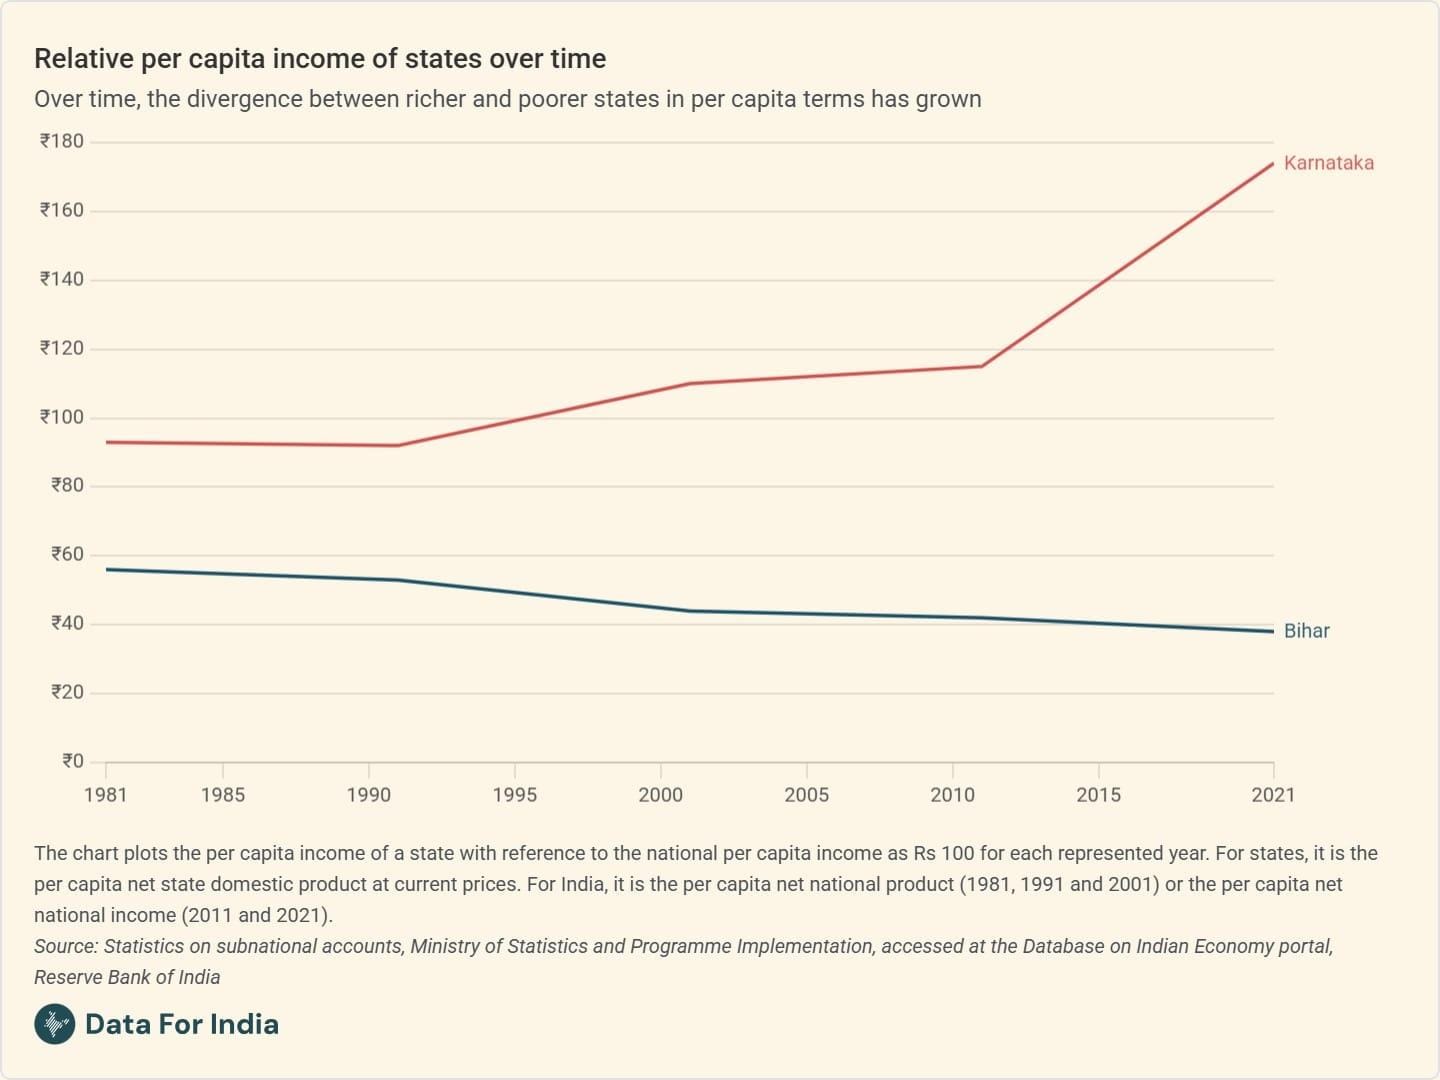
Abhishek uses a workaround that we have seen elsewhere, including in work produced by the Prime Minister's Economic Advisory Council; for the GDP of states, we look at their share of the total GDP instead, and for GDP per capita, we compare it to the national per capita for the same year.
It's a novel workaround that helps produce important insights.
But it's a workaround all the same. For those of us, like this newsletter's readers, interested in looking at the long arc of economic history, we hope that alongside upcoming changes in the way the GDP is calculated, these breaks in state-level time series are also fixed.