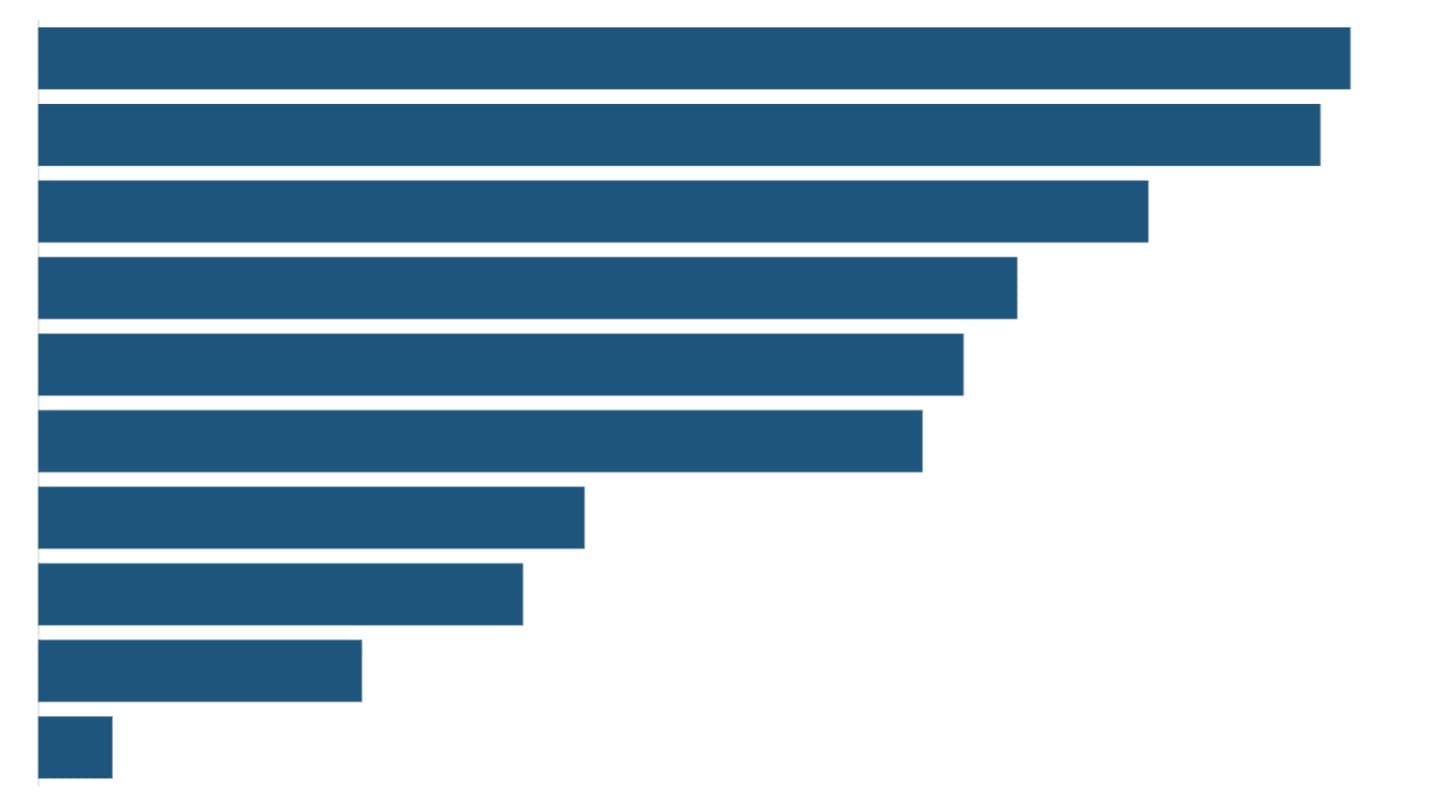
Despite substantial improvements in education, fewer than 15% of Indians above the age of 25 have completed a graduate degree.[1] The share of graduates in India's adult population is about half that in Germany and about a third of that in the US and the UK.
A higher education is often seen as a pathway to better job prospects and wages. In this piece, we look at the work status of India's 150 million graduates,[2] including the type of work they do and their wages, and examine whether a higher education guarantees better employment.
Graduates in and out of the labour force
- Not in the labour force: those who are neither working nor seeking work
- Employed: those who are working, and
- Unemployed: those who are not currently working, but seek work or are available for work
One-third of India's graduates, or about 50 million graduates, are out of the labour force. This large number of Indian graduates who are out of the labour force is driven largely by women. Low female labour force participation is a feature seen across India's labour force, at all levels of education.
Only four in ten graduate women report being in the labour force. A large section of the remaining graduate women, irrespective of their age, cite home commitments/domestic care as the reason for staying out of the labour force.
Graduate men, on the other hand, are largely in the labour force. Young graduate men who are out of the labour market are typically pursuing higher education, while older male graduates are out of the labour force largely for reasons related to health.
What graduates in the workforce do
Sixty-seven percent of India's graduates, or about 100 million graduates, are in the labour force. Of these, less than 90 million were employed in 2025.
There are more illiterate people than graduates in India's workforce: graduates make up only 16% of India's workforce, while people who are illiterate form 21% of it.
Relatively poorer states in the central and eastern parts of India have lower levels of graduates in the workforce, due to lower enrolment in higher education. In Bihar, for instance, the gross enrolment ratio in higher education is 18% compared to the national average of 30%. As a result, graduates make up only 11% of Bihar's workforce, as compared to 15% nationally.
In comparison, Tamil Nadu and Kerala have high levels of enrolment in higher education, and graduates form 20% of the workforce.
More salaried jobs
In Indian labour statistics, workers are classified into four types of working arrangements - salaried jobs, casual work, self-employed, and unpaid helpers in family enterprises. Salaried jobs have the highest wages, more stability and are more likely to come with social security benefits.
Higher education raises the chances of being in salaried employment: only 7% of illiterate workers are in salaried jobs, compared to 56% of graduate workers.
Higher rates of formal employment
A little more than 10% of India's workers are engaged in formal employment. A formal job is the one that guarantees at least one of three conditions: a long term job contract, some social protection means such as provident fund and healthcare, and eligibility for paid absence from work.
Among graduate workers, the share of formal jobs is 40%. Formal jobs are much less common among those with a secondary education or less.
Half of the graduates in formal jobs work in the private sector while the other half work in government and its agencies.
The wage premium for graduates
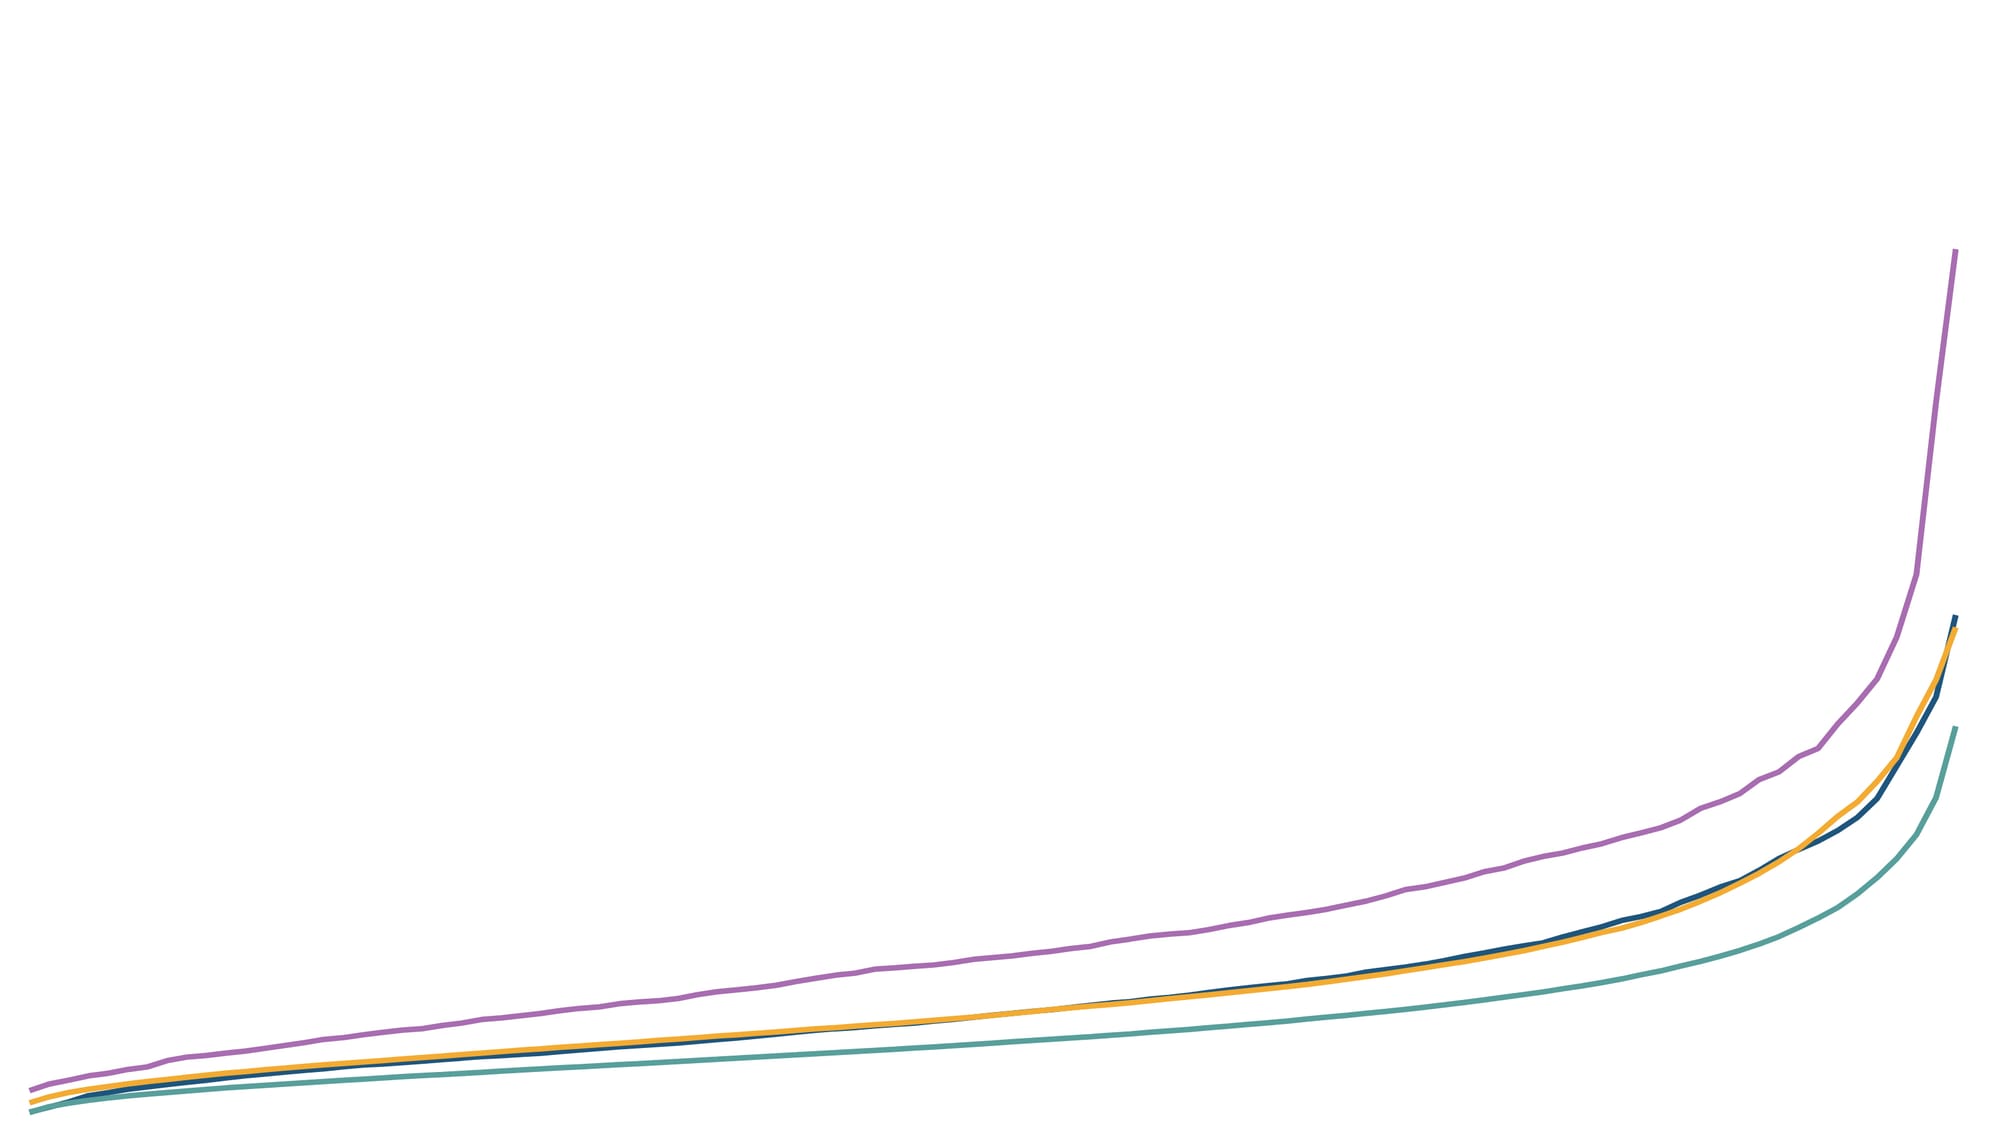
For most Indians, income from labour - or wages[3] - forms the majority of their household income. In 2025, the median casual worker in India earned an estimated Rs 9,000, while the median self-employed worker earned Rs 12,000 in a 30-day period. Salaried workers earned the most, as their median earnings were estimated at Rs 15,000 in a calendar month.
Education levels are strongly associated with differences in wages. Across employment types, graduate workers earn more than non-graduate workers. The wage gap is the lowest among casual workers, and the highest among salaried workers.
Higher-skilled areas of work
Graduates in India's workforce are largely employed in those sectors of the economy that require a higher level of skills.
In economic terms, there are three major sectors of economic activity and work - agriculture, industry and services.
While the share of Indian workers in agriculture is declining steadily, it still remains the largest employer of Indian workers. However, when we look at the section of the workforce that is educated at or beyond the level of graduation, the picture looks different. The services sector, and not agriculture, is the top employer of graduates, engaging two-thirds of graduate workers.
At the level of occupations of workers as defined under the National Classification of Occupations, uneducated workers are most likely to be in agricultural activities, or to be working as construction workers. Workers with a primary education have similar occupations, or work as shop salespersons. Those with a secondary education are also likely to work as cab drivers in addition to the occupations found common among workers with a primary education.
A higher education allows workers to go beyond agriculture, construction and trade. Graduates are more likely to be teachers and software developers than those without a higher education. On the other hand, diploma holders are likely to be electricians and auto/machine shop mechanics.
Unemployment among India's graduates
Two-thirds of India's graduates, or 100 million, are in India's labour force. But not all of them are employed for most of the year.[4]
While India's national unemployment rate was 3.1% in 2025, the unemployment rate among graduates was over three times as high at 11%. The unemployment rate is nearly zero, on the other hand, among people in the labour force who are illiterate.
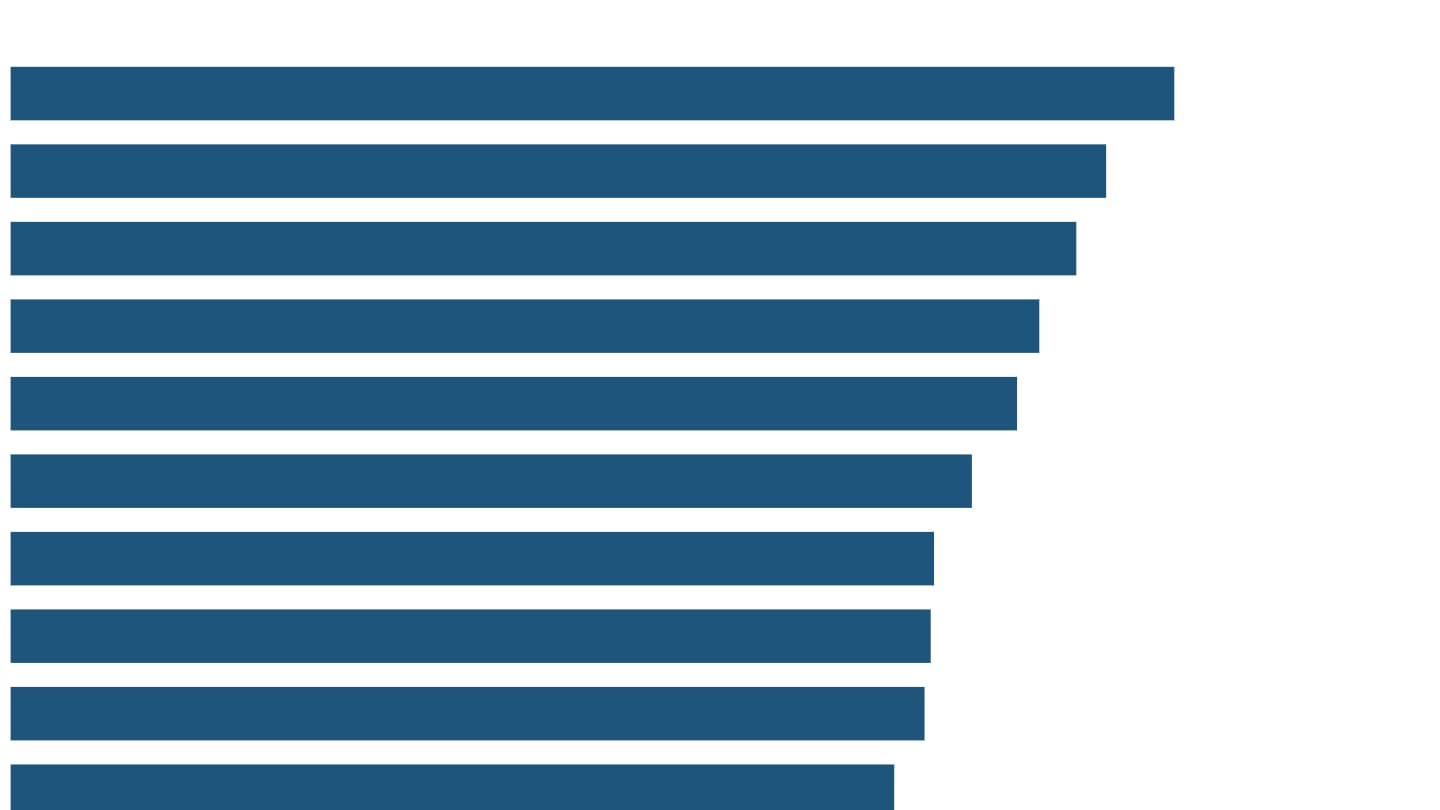
Globally, India's high graduate unemployment rate has parallels with some other low- and middle-income developing economies. India's graduate unemployment rate, however, is three to five times higher than that in the advanced economies of Europe and North America.[5]
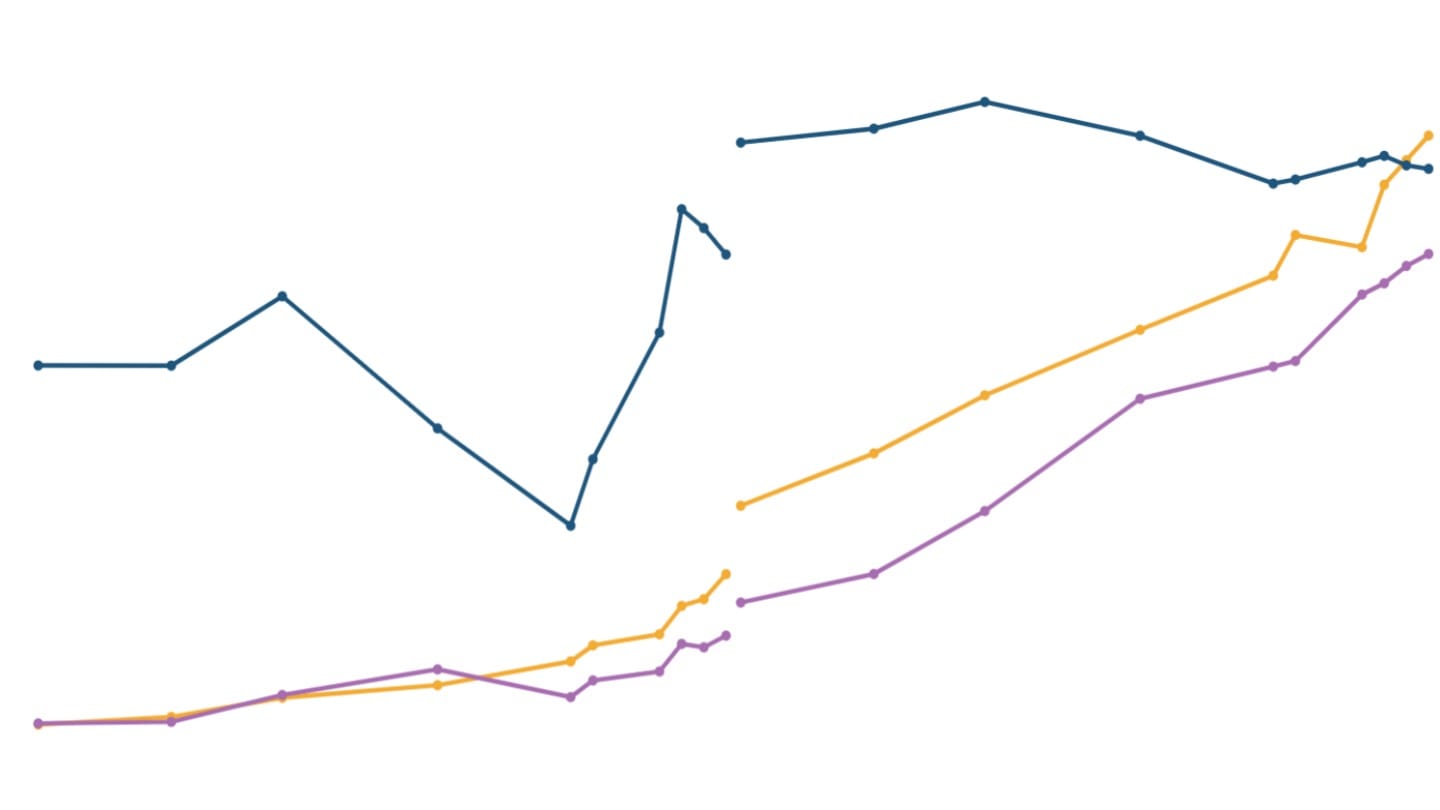
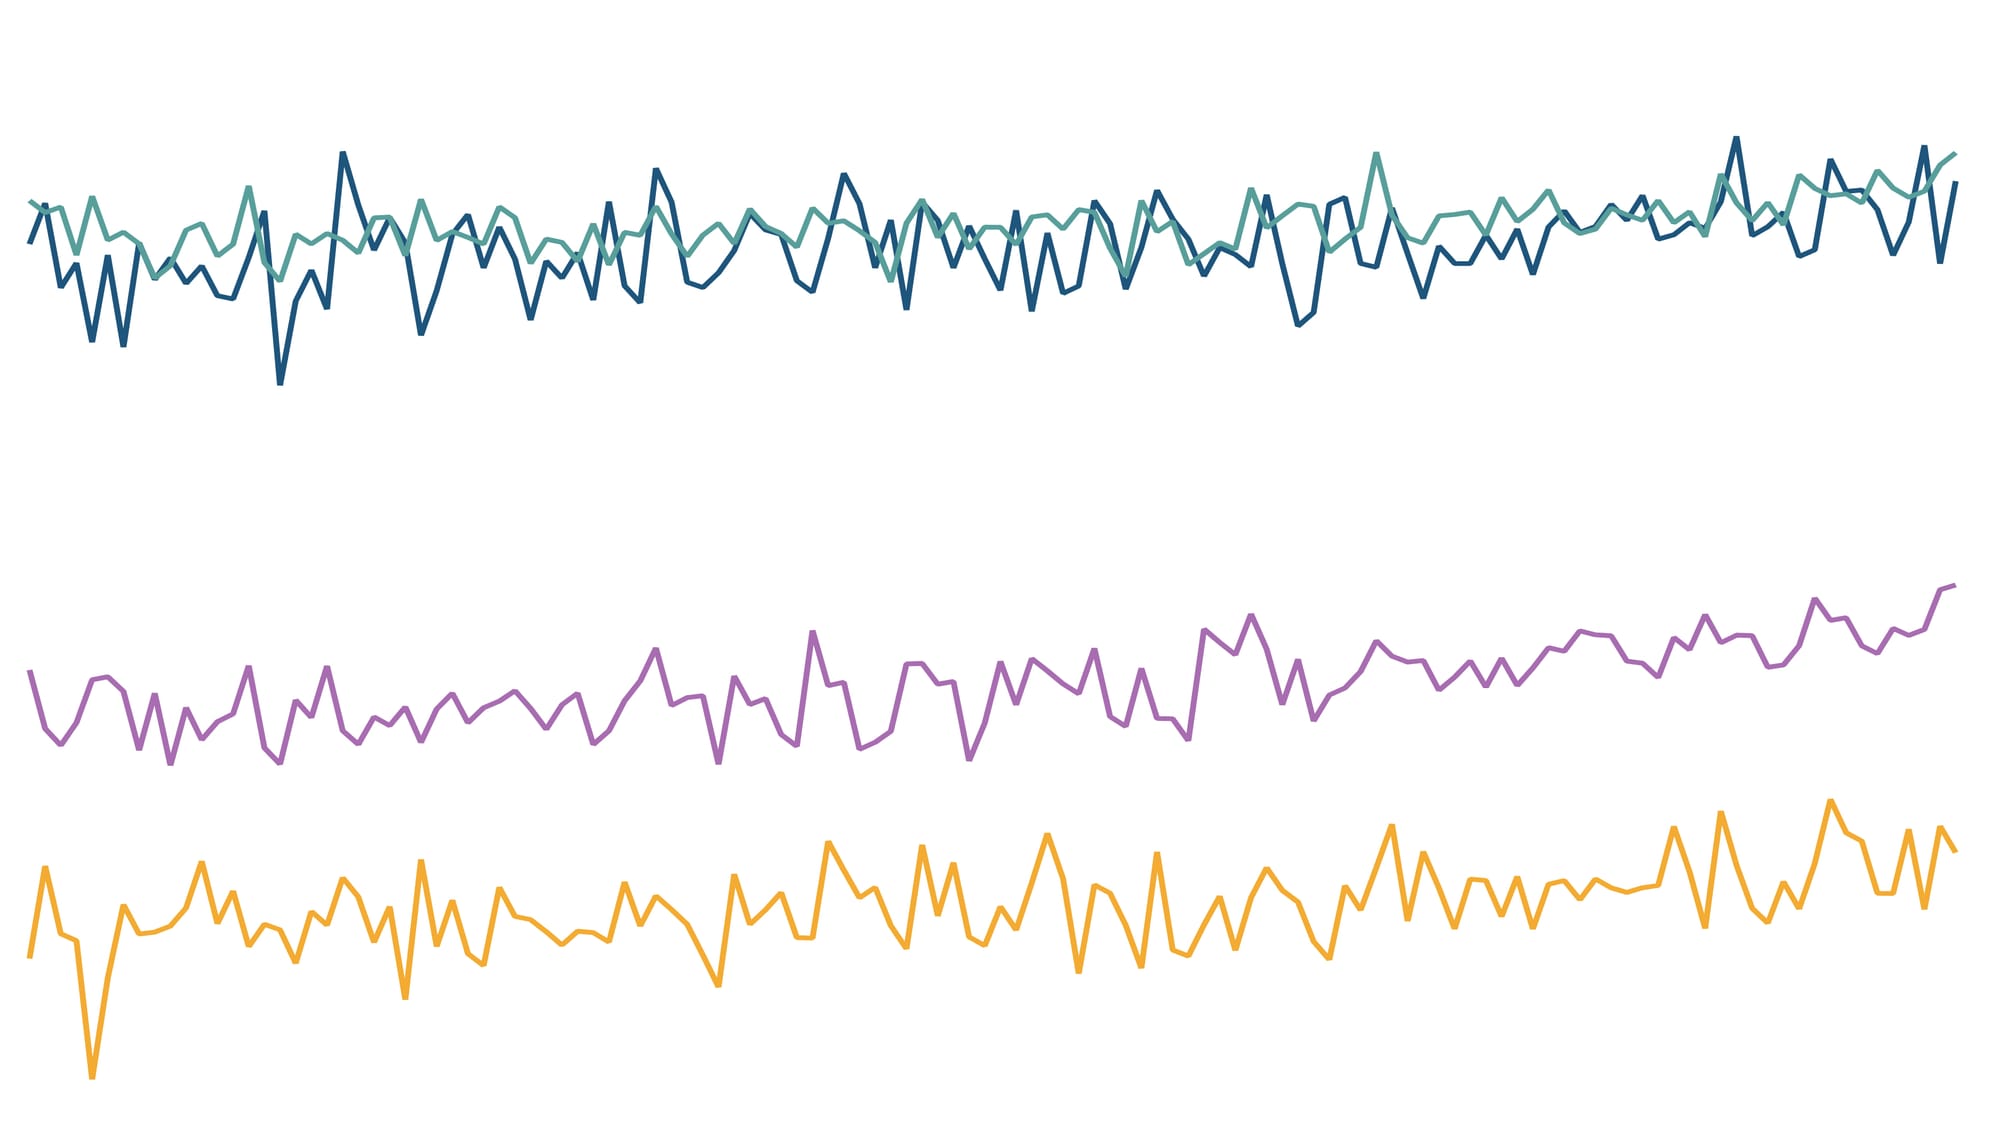
Among graduates, the unemployment rate is the highest among those in their twenties, many of whom are likely to be fresh graduates. One-third of graduates in their early twenties are unemployed. The graduate unemployment rate gradually drops with age.
As many as 85% of the unemployed graduates are below the age of 30.
Higher unemployment among the higher educated reflects both a lack of quality employment opportunities, and the relative ability of better educated young people to hold out for better opportunities, research by the International Labour Organization and the Institute for Human Development finds. Candidates with higher education such as graduation or above are unwilling to work in low-paying and insecure jobs, and tend to wait until they get an opportunity that suits their needs. However, graduates from disadvantaged social groups who cannot afford to wait for the right job may be forced to accept any type of work available in the market.[6]
While higher educated youth demand well-paying and secure jobs, the supply of such jobs has not been commensurate; growth in high-quality jobs has been slower than the growth in educated candidates, the ILO-IHD report finds.[7]
[1] This estimate is produced using the Periodic Labour Force Survey 2025, which records the highest level of education successfully completed by household members. Diploma or certificate courses equivalent to graduation level are considered out of the definition of a 'graduate'.
[2] The absolute number of graduates is estimated using the share of graduates derived from the Periodic Labour Force Survey and the estimate of population from the Registrar General and Census Commissioner of India.
[3] In the Periodic Labour Force Survey, earnings are recorded for workers in the Current Weekly Status. For salaried workers, earnings for the preceding calendar month are recorded. For self-employed workers, gross earnings minus the expenses for the preceding 30 days are recorded. For casual workers, earnings for each day of the preceding seven days are recorded. Earnings of casual workers are measured for each day for the preceding seven days, but we have normalised them for 30 days using an arithmetic factor (30/7). The calculation uses data from the First Visit of PLFS only (PLFS also has a Revisit schedule).
[4] India's Periodic Labour Force Survey records activity status of household members in two ways. Activities engaged in for the major part of the year (principal status) and those engaged in for shorter periods (subsidiary status) together make the Usual Status. Activities performed over the seven days preceding the survey are used to arrive at the Current Weekly Status. We use the Usual Status method to understand employment in India.
[5] Unemployment with advanced education (% of total labour force with advanced education), World Development Indicators, World Bank.
[6] India Employment Report 2024, International Labour Organization (ILO) and Institute for Human Development (IHD).
[7] India Employment Report 2024, International Labour Organization (ILO) and Institute for Human Development (IHD).