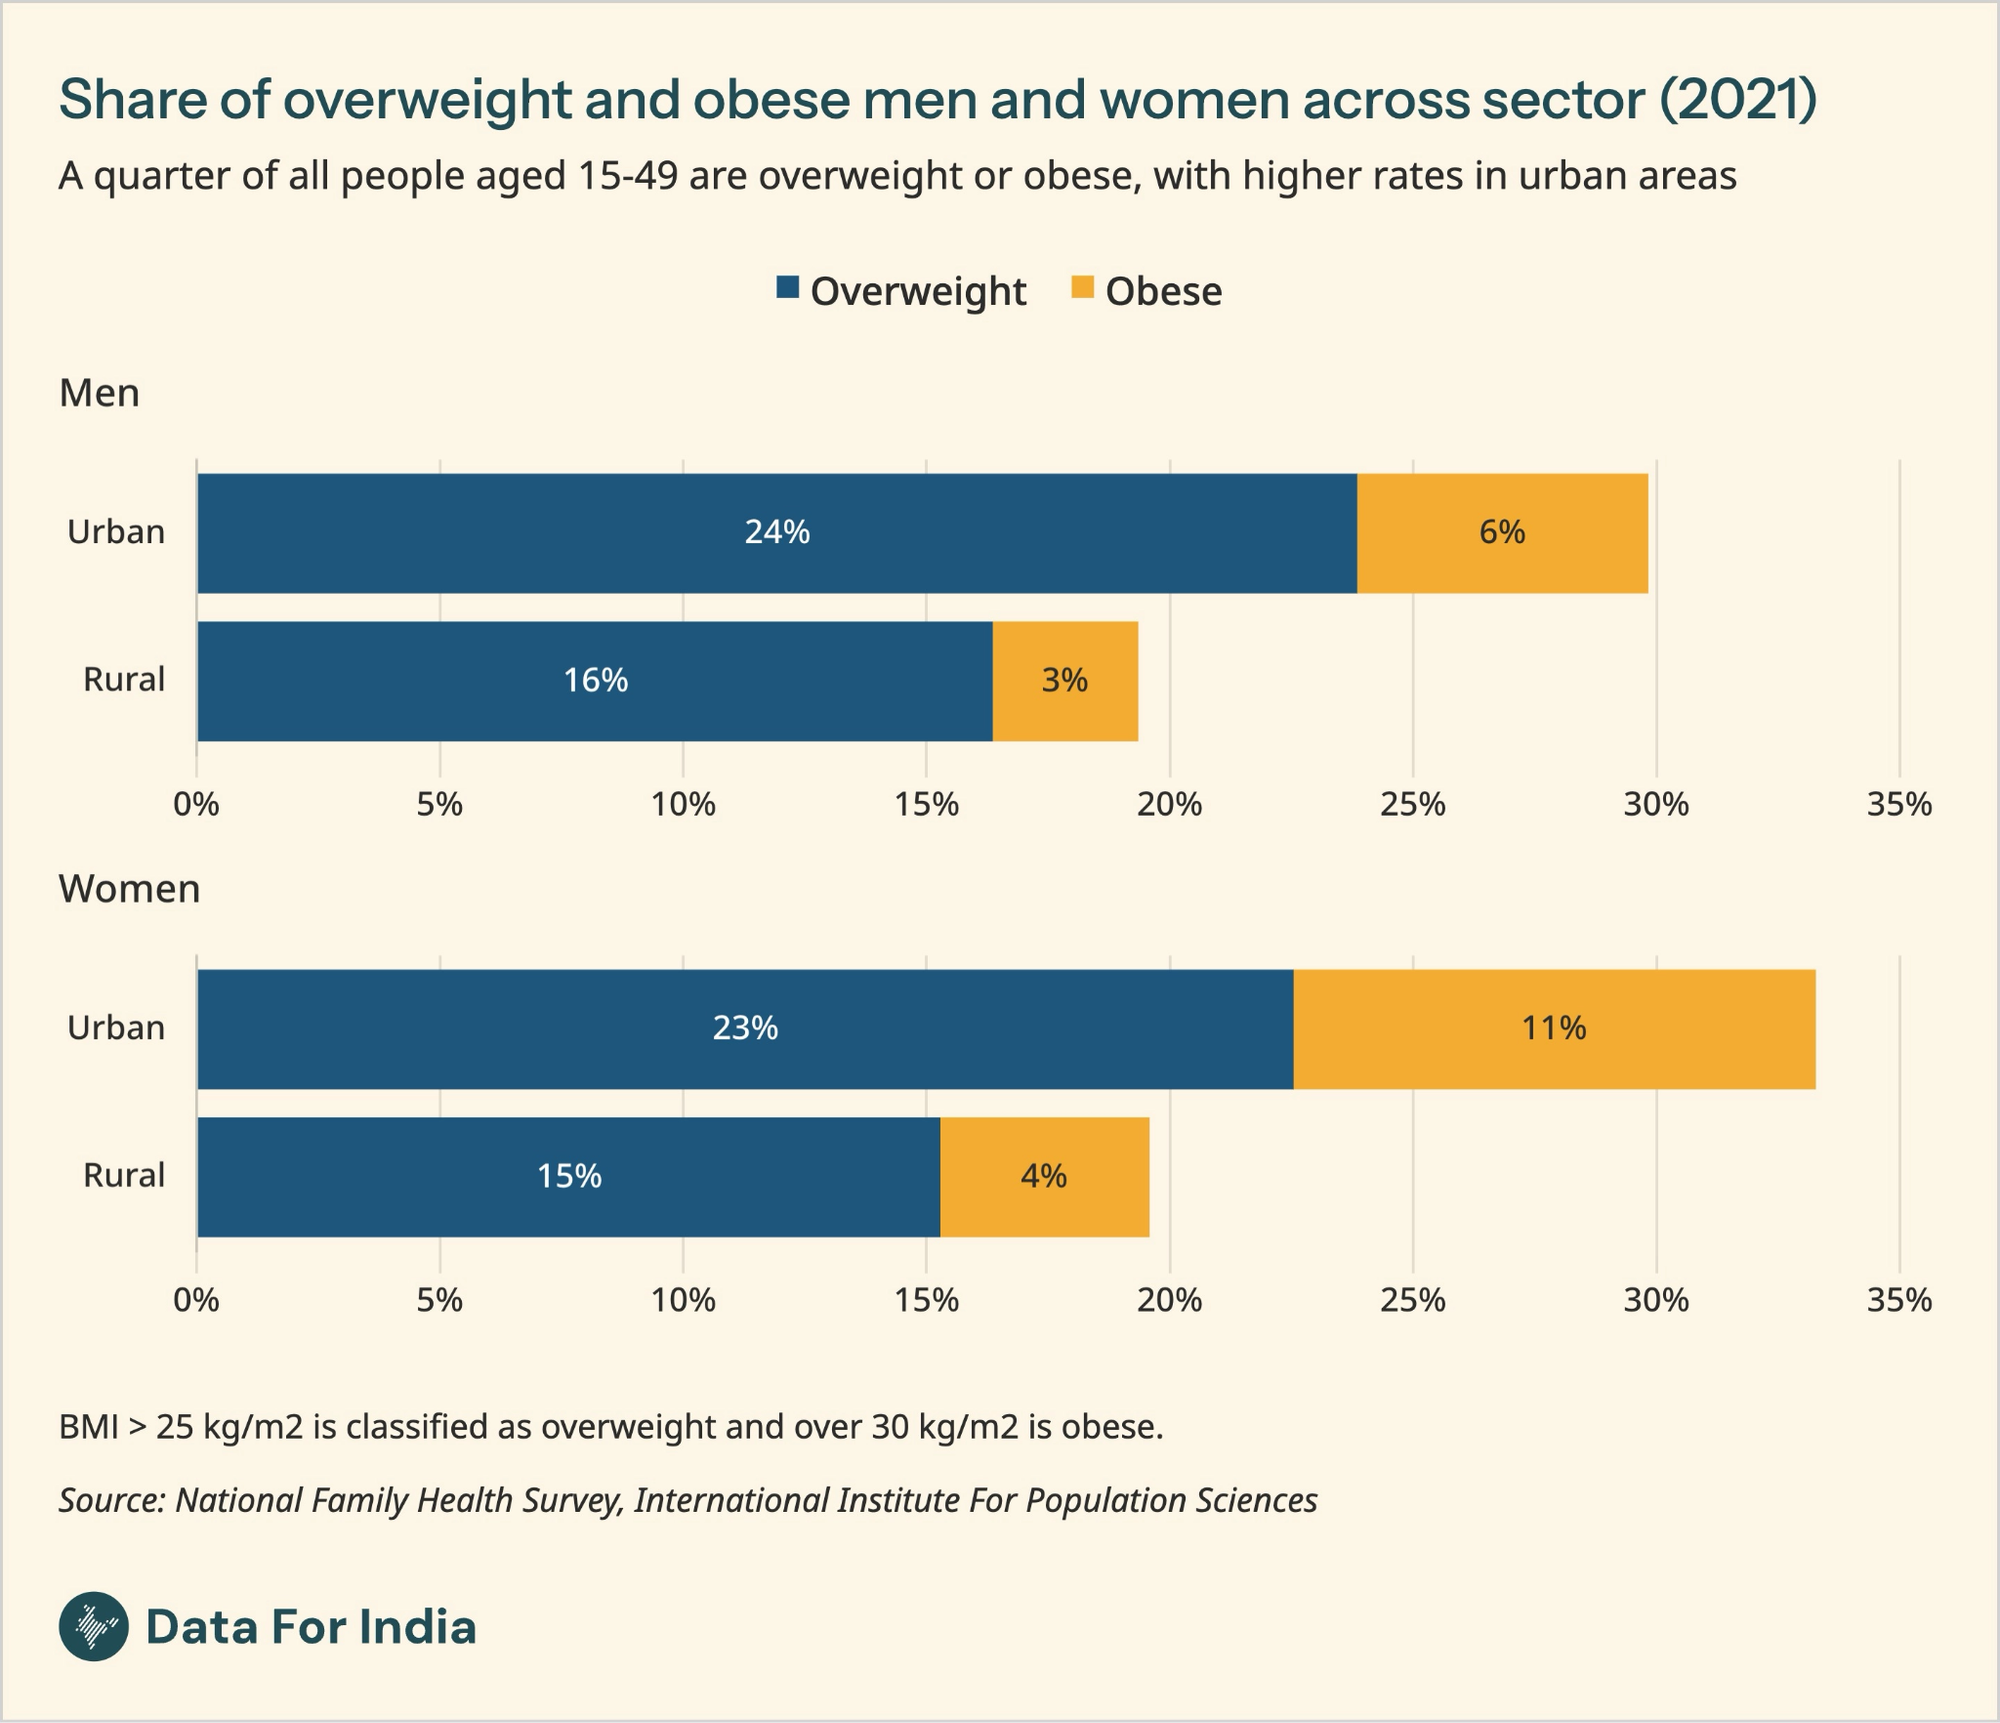
Obesity is a growing public health concern in India. The National Family Health Survey 2019-21 found that nearly a quarter of women and men aged 15-49 were overweight or obese. The latest NFHS round conducted in 2023-24 shows that this share has increased further to around 30%.[1]
Obesity is associated with several health risks, including cardiovascular diseases, which are an increasing public health concern in India. However, the prevalence of obesity and the health risks associated with it vary depending on what metric is used to measure it and where the threshold is set. Understanding these measures is therefore important to make sense of both the scale of the problem and how it has changed over time. This piece looks at what the NFHS tells us about obesity in India, beginning with a closer look at how we measure it and the relevance of the indicator used.
What are anthropometric indices and why do we use them?
Anthropometric measurements, i.e. measures of the human body, are among the simplest tools available for assessing the health and nutritional status of a population. For adults, the most commonly used indices include Body Mass Index (BMI), Waist-to- Hip Ratio (WHR), Waist Circumference (WC), and Waist-to-Height Ratio (WHtR). Each of these indicators comes with its own strengths and blind spots. These indices are used as proxies for identifying the share of the population that may be at risk of cardiovascular and metabolic diseases.
In this piece we take a closer look at BMI and WHR which is included in NFHS-5. BMI has been part of the NFHS since its second round in 1998-99[2], which was focused on women aged 15-49. Waist and hip circumference, used to calculate WHR, were included only in the most recent round in 2019-21, as part of the biomarker measurements collected for adults along with height and weight[3].
Body Mass Index (BMI)
BMI is calculated by dividing a person's weight in kilograms by the square of their height in metres. It is the most widely used measure of obesity globally, largely because it is quick, cheap, and easy to collect and calculate at scale. The NFHS uses BMI as its primary indicator for categorising overweight and obesity in adults.
The standard World Health Organisation (WHO) cut-offs place underweight below 18.5, normal between 18.5 and 24.9, overweight between 25 and 29.9, and obese at 30 and above.[4] For instance, a woman who is 5'1'' tall and weighs 52 kg has a BMI of about 21.6, which falls in the normal range. If she weighed 62 kg at the same height, her BMI would rise to about 25.8, putting her in the overweight category.
However, growing evidence suggested that these cut-offs may not accurately reflect health risks in Asian populations. Recognising this, a WHO Expert Consultation on BMI in Asian populations, convened in Singapore in 2002.[5] They concluded that the existing international BMI cut-offs did not adequately capture obesity-related health risks in Asian populations. People in many Asian populations tend to have a higher percentage of body fat than European populations at the same BMI, and as a result face an increased risk of conditions such as type 2 diabetes and cardiovascular disease at lower BMI levels.
Following this, in 2009, over a hundred Indian medical experts representing major research institutions, hospitals and policy bodies developed consensus guidelines for India specifically, defining overweight as BMI between 23 and 24.9 and obesity as BMI of 25 or above.[6]
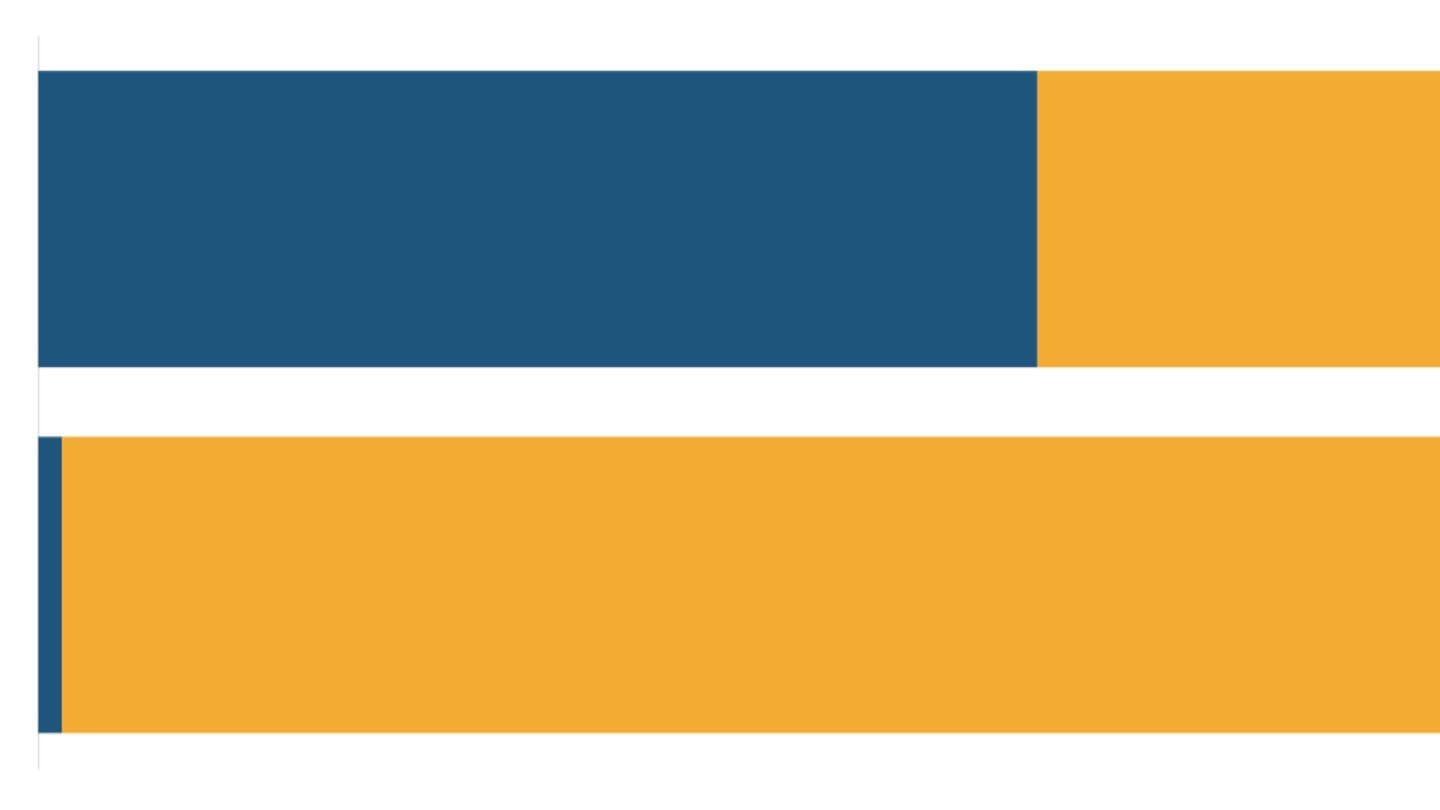
While the NFHS continues to use the original international cut-offs for identifying obesity, individuals whose BMI falls above the Indian risk threshold but below the international obesity threshold are classified as overweight. As a result, obesity prevalence in 2021 stands at 4% among men and 6% among women using the NFHS definition. However, when India-specific BMI thresholds are used and both overweight and obese individuals are considered at risk, the share rises to 23% among men and 24% among women.[7]
Waist-to-Hip Ratio (WHR)
Waist-to-Hip Ratio (WHR) is calculated by dividing waist circumference by hip circumference. Unlike BMI, it tells us about fat distribution in the body. Abdominal or visceral fat, the kind that accumulates around the stomach and internal organs, is far more dangerous than fat stored elsewhere. WHR is a stronger predictor of type 2 diabetes and is increasingly recognised as a significant risk factor for heart disease.[8] According to WHO, a healthy WHR is 0.90 or less for men and 0.85 or less for women.[9]
However, measuring WHR accurately is harder than measuring BMI. While waist circumference can be taken relatively easily, accurate hip circumference measurement requires disrobing, which can be a practical obstacle, particularly for women in India.[10]
In 2021, 57% of women and 48% of men exceeded this threshold placing them at higher risk of cardiometabolic diseases associated with abdominal obesity.[11] By comparison, less than half as many were classified as overweight or obese based on BMI - 24% among women and 23% among men.
Limitations of these indicators
Both BMI and WHR are useful at the population level, but each has its limitations.
Body composition
BMI's biggest limitation is that it cannot distinguish between fat and muscle. A person who is heavily built and physically fit can have the same BMI as someone who is obese.[12] This makes BMI unreliable for assessing individuals. Despite this, BMI remains the only indicator used to classify obesity in the NFHS.
Ethnicity and body fat distribution
The bigger problem for a country like India is that BMI takes no account of where fat is stored in the body. Fat distribution varies significantly across ethnic groups. South Asians, including Indians, tend to accumulate more visceral fat at a lower BMI than European populations.[13] This implies that the actual health risk in India could be higher than the BMI-based figures suggest.
This is the reason why the 2009 Indian consensus guidelines recommended using both BMI and waist circumference, which is considered more reliable than WHR, giving equal weight to both, for assessing cardiovascular and metabolic risk, instead of relying on BMI alone.
Determining cut-offs
The guidelines also recommend using both BMI and waist circumference with cut-offs tailored to Indian populations, recognising that internationally used thresholds may not accurately capture health risks among Indians and other South Asians.
The same concern applies when using WHR alongside BMI. The standard international thresholds used to define abdominal obesity may not fully reflect risk patterns in Indian populations, who tend to develop metabolic complications at lower levels of body fat.
Waist circumference thresholds vary across ethnic groups. In India, the recommended upper limit is 90 cm for men and 80 cm for women, compared with the WHO's global cut-offs of 94 cm and 80 cm, respectively.[14]
Even within India, ethnic diversity adds another layer of complexity. The country is far from a homogeneous population, and body composition, fat distribution, and susceptibility to metabolic diseases vary across regions and communities.[15] As a result, identifying a single threshold for both waist circumference and WHR, that accurately reflects health risk for all Indians, remains a challenge.
Gender and age complicate the picture
Gender and age further complicate how these measures should be interpreted.
Women tend to carry a higher percentage of body fat than men at the same BMI, which means BMI underestimates risk differently depending on gender.[16] For women, conditions like polycystic ovarian syndrome (PCOS), which is linked to insulin resistance and fat distribution, is an additional and often overlooked source of cardiovascular risk. This is not linked to BMI directly and is affected by body fat distribution.[17] In 2021, more than half of women aged 15-49 who had a normal BMI were still at increased health risk because they had abdominal obesity based on their WHR.
Age is also a significant factor. As people get older, muscle mass tends to decline and gets replaced by fat, even when body weight stays roughly the same. This means an older person's BMI can look unchanged while their actual body composition and their health risks have shifted significantly.[18]
Large sections of the population at risk, like women and elderly population, cannot be correctly assessed using the uniform BMI based cut-off.
Interpreting the data
At a population level, BMI and WHR are useful and practical tools for tracking how nutritional status is changing over time. However, they can mask important variation within the population across age groups, genders, regions, and communities, particularly when clear, population-specific cut-offs do not exist. There is a need to better understand how obesity is measured and what drives it among different population groups in order to effectively address the problem.
At an individual level, both indicators should be understood as starting points, not complete assessments.[19] They point toward risk, but they cannot fully account for the complexity of how different bodies accumulate and carry fat, or what that means for health outcomes.
[1] National Family Health Survey Factsheet 2023-24, International Institute of Population Sciences.
[2] National Family Health Survey 2 Biomarker Questionnaire, International Institute of Population Sciences.
[3] National Family Health Survey 5 Biomarker Questionnaire, International Institute of Population Sciences.
[4] National Family Health Survey 2019-21, International Institute of Population Sciences.
[5] Appropriate body-mass index for Asian populations and its implications for policy and intervention strategies (2004), WHO Expert Consultation, The Lancet.
[6] Consensus Statement for Diagnosis of Obesity, Abdominal Obesity and the Metabolic Syndrome for Asian Indians and Recommendations for Physical Activity, Medical and Surgical Management (2009), Misra, Archan & Chowbey et al.
[7] National Family Health Survey 2019-21, International Institute of Population Sciences.
[8] A Comparison of Anthropometric Indices for Predicting Hypertension and Type 2 Diabetes in a Male Industrial Population of Chennai, South India (2008), Kaur, Radhakrishnan, et al, Ethnicity and Disease.
[9] Waist Circumference and Waist-Hip Ratio: Report of a WHO Expert Consultation.
[10] Consensus Statement for Diagnosis of Obesity, Abdominal Obesity and the Metabolic Syndrome for Asian Indians and Recommendations for Physical Activity, Medical and Surgical Management (2009), Misra, Archan & Chowbey et al.
[11] National Family Health Survey 2019-21, International Institute of Population Sciences
[12] BMI, aka body mass index: What the science says (2024), Standform medicine.
[13] Defining and Diagnosing Obesity in India: A Call for Advocacy and Action (2023), Kalra, Kapoor et al., Journal of obesity.
[14] Waist Circumference and Waist-Hip Ratio: Report of a WHO Expert Consultation.
[15] Ethnicity, obesity and health pattern among Indian population (2012), Mungreiphy, Dhall et al, Journal of Natural Science, Biology and Medicine.
[16] Obesity: a gender-view (2024), Muscogiuri, Journal of Endocrinological Investigation.
[17] Cardiovascular Risk According to Body Mass Index in Women of Reproductive Age With Polycystic Ovary Syndrome: A Systematic Review and Meta-Analysis (2022), Zhuang et al, Frontiers in Cardiovascular Medicine.
[18] Age-appropriate BMI cut-offs for malnutrition among older adults in India (2024), Singh, Chattopadhyay, Scientific reports.
[19] BMI or not to BMI? debating the value of body mass index as a measure of health in adults (2025), Shanks, Bruening, et al, International Journal of Behavioral Nutrition and Physical Activity.