Rainfall shapes nearly every dimension of India's economy, ecology and food systems. Rain-fed agriculture occupies over half of India's cultivated land, making the timing and distribution of rainfall critical for agricultural production, rural livelihoods and national food security.[1] Rainfall fluctuates sharply from year to year, varies widely across regions, and is influenced by complex interactions among ocean temperatures, atmospheric circulation, land conditions and large-scale climate systems.
Long-term observations compiled by the India Meteorological Department (IMD) indicate that although total annual rainfall across India has remained broadly stable since the early twentieth century, rainfall is becoming more concentrated and erratic in several regions. This article examines long-term rainfall patterns across the country.
Long-term trends
Rainfall data in India comes from observational records maintained by the IMD. These datasets combine observations from thousands of rain gauges across India and extend back to 1901 making them among the longest rainfall records available for any tropical monsoon region.
Over time, the IMD has converted these station observations into spatially continuous datasets known as gridded datasets, which fill in the gaps between rainfall measurements from individual stations across a regular grid covering the entire country. The most widely used dataset from the IMD provides rainfall values at a spatial resolution of 0.25 degrees,[2] enabling researchers to analyse rainfall patterns at relatively fine spatial scales. These gridded datasets are widely used in climate research because they allow rainfall patterns to be examined consistently across both space and time.
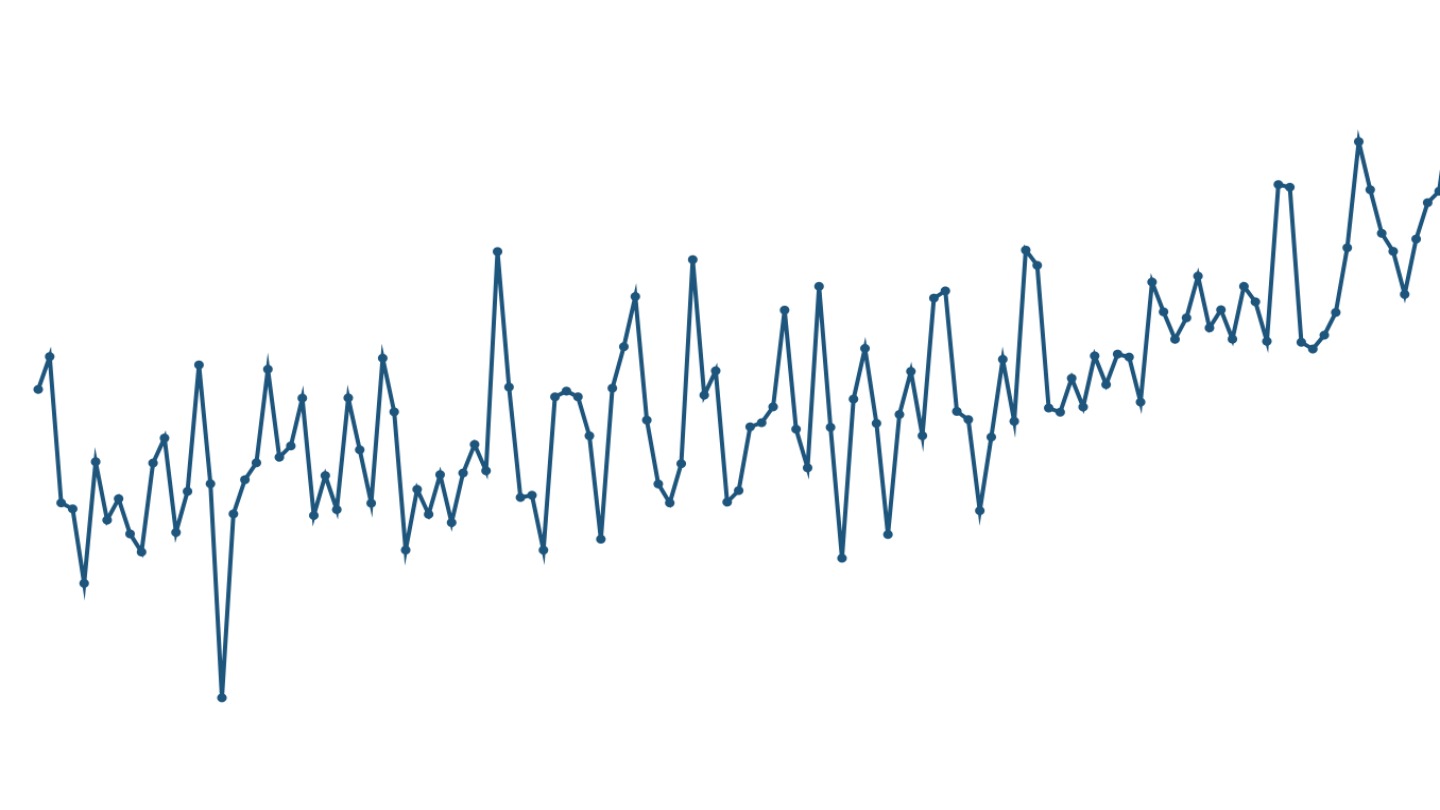
On average, India receives between 1,000 and 1,300 mm rainfall over the course of a year based on the all-India long-term average calculated over 1901-2024. Over the past century, there have been considerable year-to-year fluctuations, but the cumulative annual rainfall has remained broadly stable,[3] showing only a weak and statistically insignificant decline.[4]
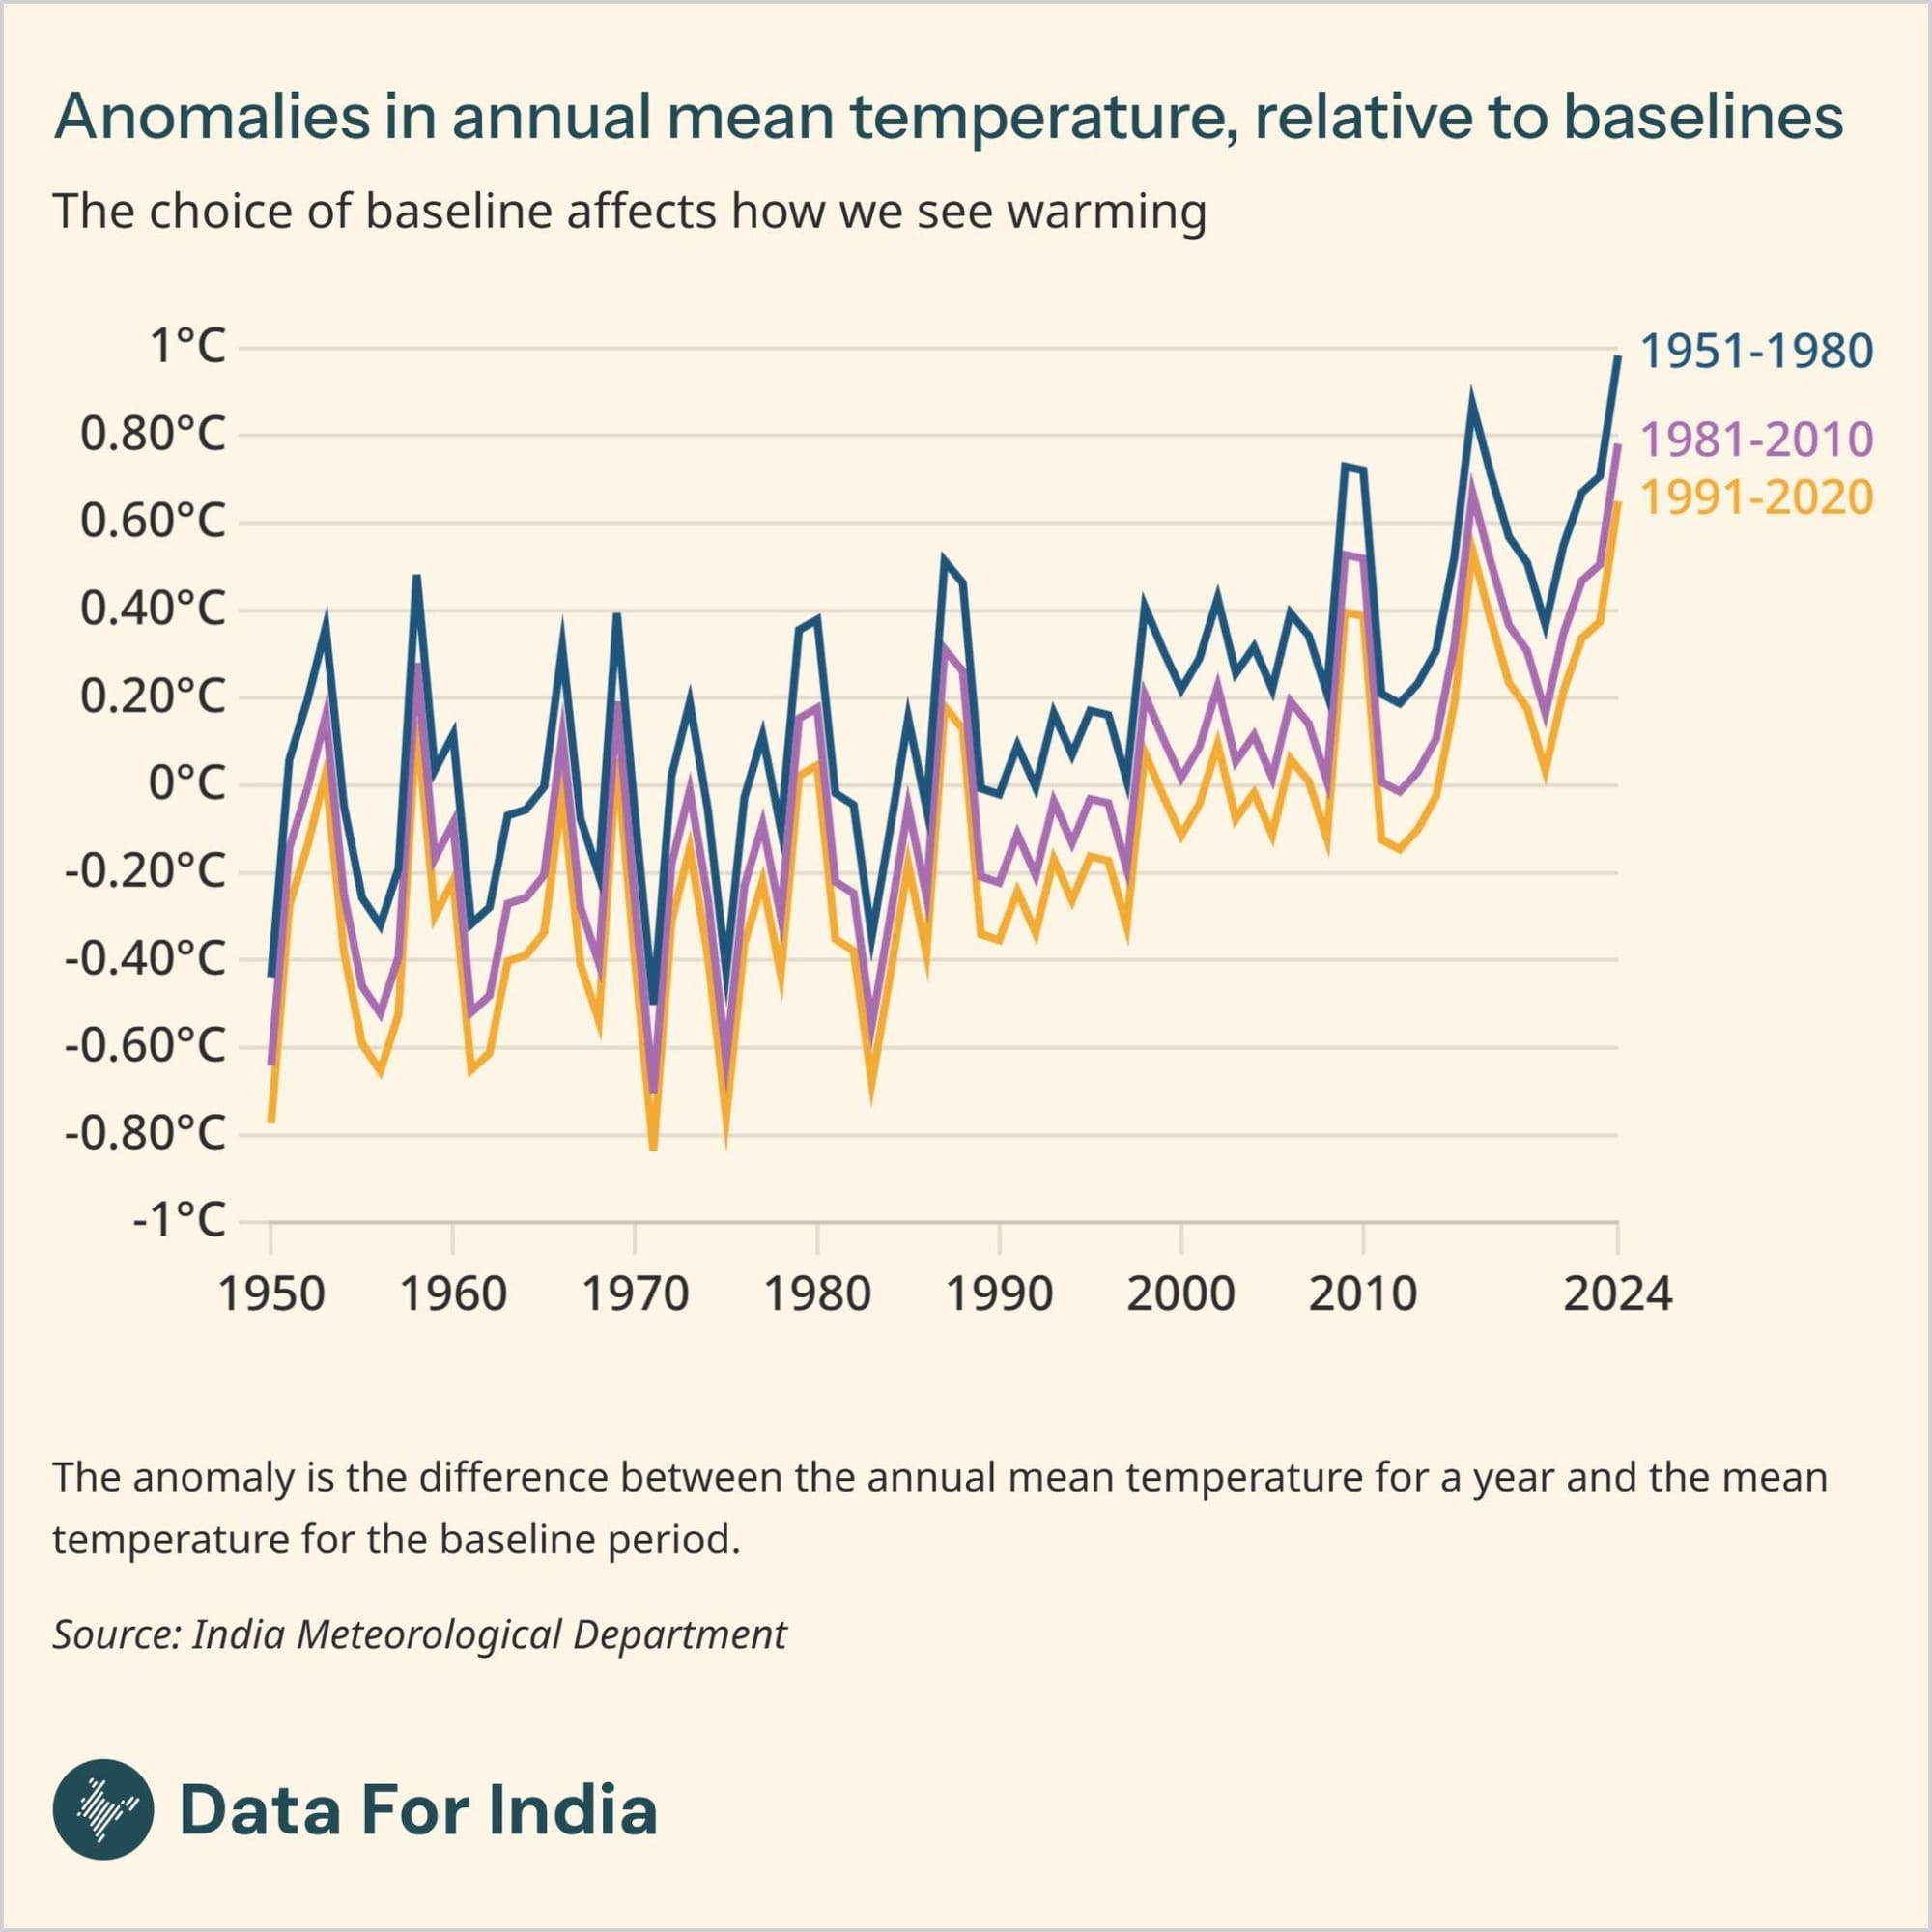
This marks India's annual rainfall patterns as distinct from its temperature trends, where we see a clear increase in average temperatures over time.
Rainfall anomalies - deviations from the 'normal'
Rather than absolute totals alone, expressing changes in rainfall as anomalies allows for determination of whether a year was wetter or drier than normal, enabling comparisons across regions with very different rainfall regimes and making it easier to identify long-term climate patterns.
A rainfall anomaly is defined as the deviation of observed rainfall from a long-term average. The deviation can be expressed either in millimeters or as a percentage departure from the long-term mean, which is the most commonly used measure in climate analysis. The benchmark used for such comparisons is the Long Period Average (LPA),[5] the average rainfall over a defined region calculated over a long-term base period, typically spanning 30-50 years. Using such an extended period smoothens out fluctuations in individual years caused by climate phenomena such as El Niño[6] and La Niña[7], providing a stable reference against which individual years can be evaluated.
The official rainfall normals used in India are calculated by the IMD, which currently uses the 1971-2020 period as its climatological baseline. Based on this dataset, the LPA for India's annual rainfall is 1160.1 mm.
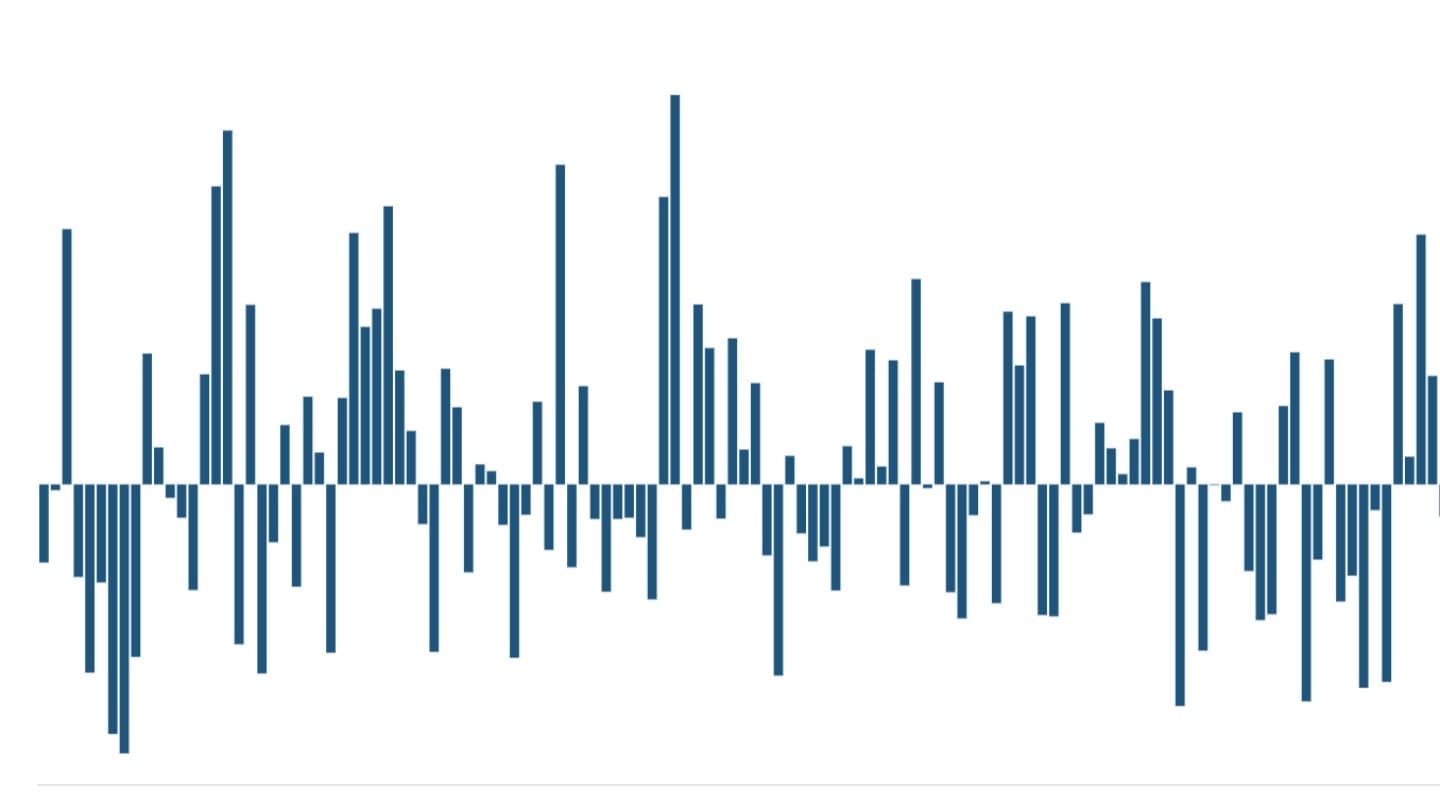
At the national scale, India's annual rainfall record shows only a mild change in the long-term trend. Over the past century, there has been a modest but statistically weak reduction in annual rainfall. The first half of the 20th century (1901-1959) experienced rainfall about 3.6% above the long-term average, while recent decades are effectively close to the baseline. However, this apparent stability masks considerable variability. Individual years have recorded substantial positive and negative departures. Such fluctuations matter because even moderate national anomalies can translate into major regional droughts or floods.
Classification of rainfall years
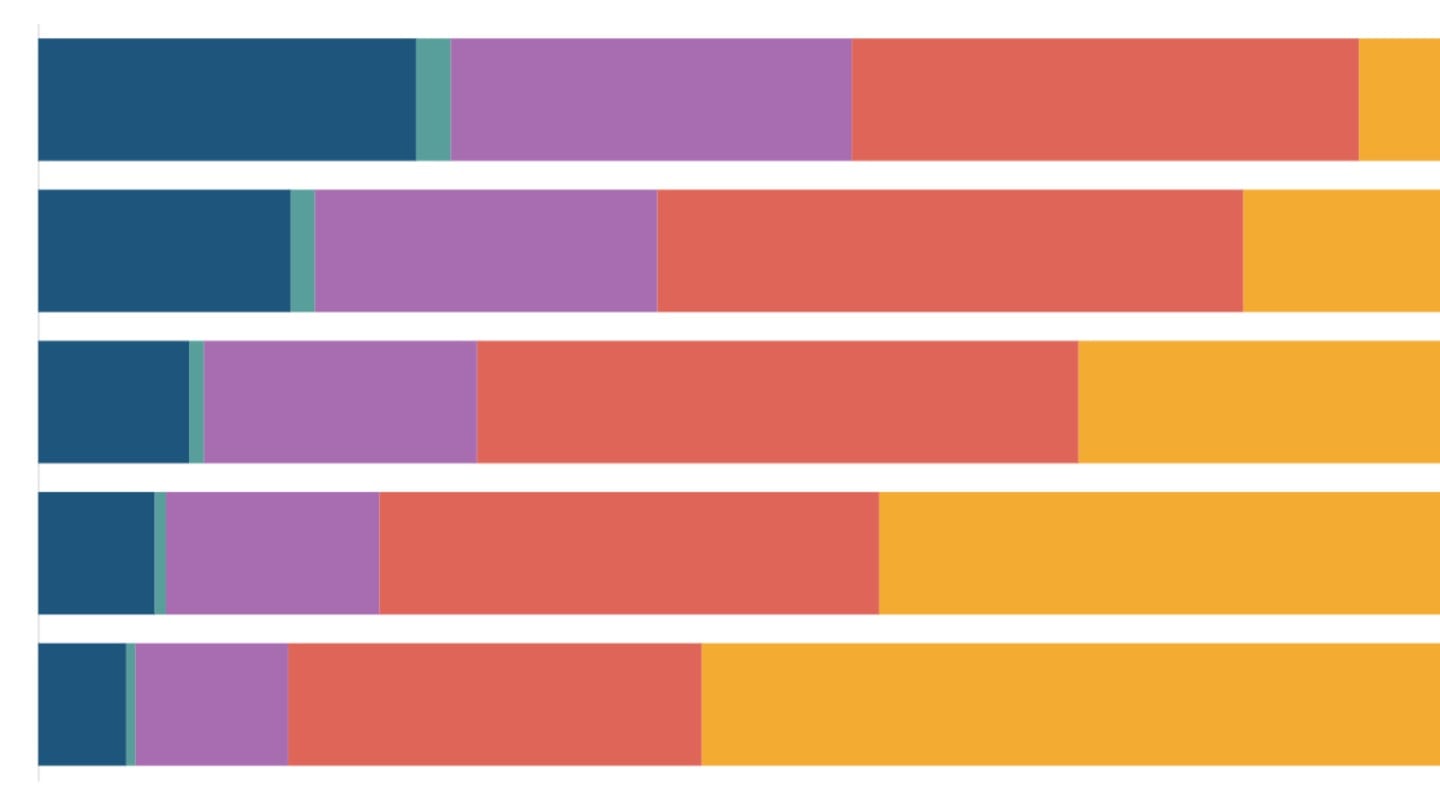
To interpret rainfall variability consistently, the IMD classifies each year according to its percentage departure from the Long Period Average (LPA).[8] By grouping each year into one of the five categories, it illustrates how rainfall outcomes have been distributed historically and how this distribution has shifted across decades.[9]
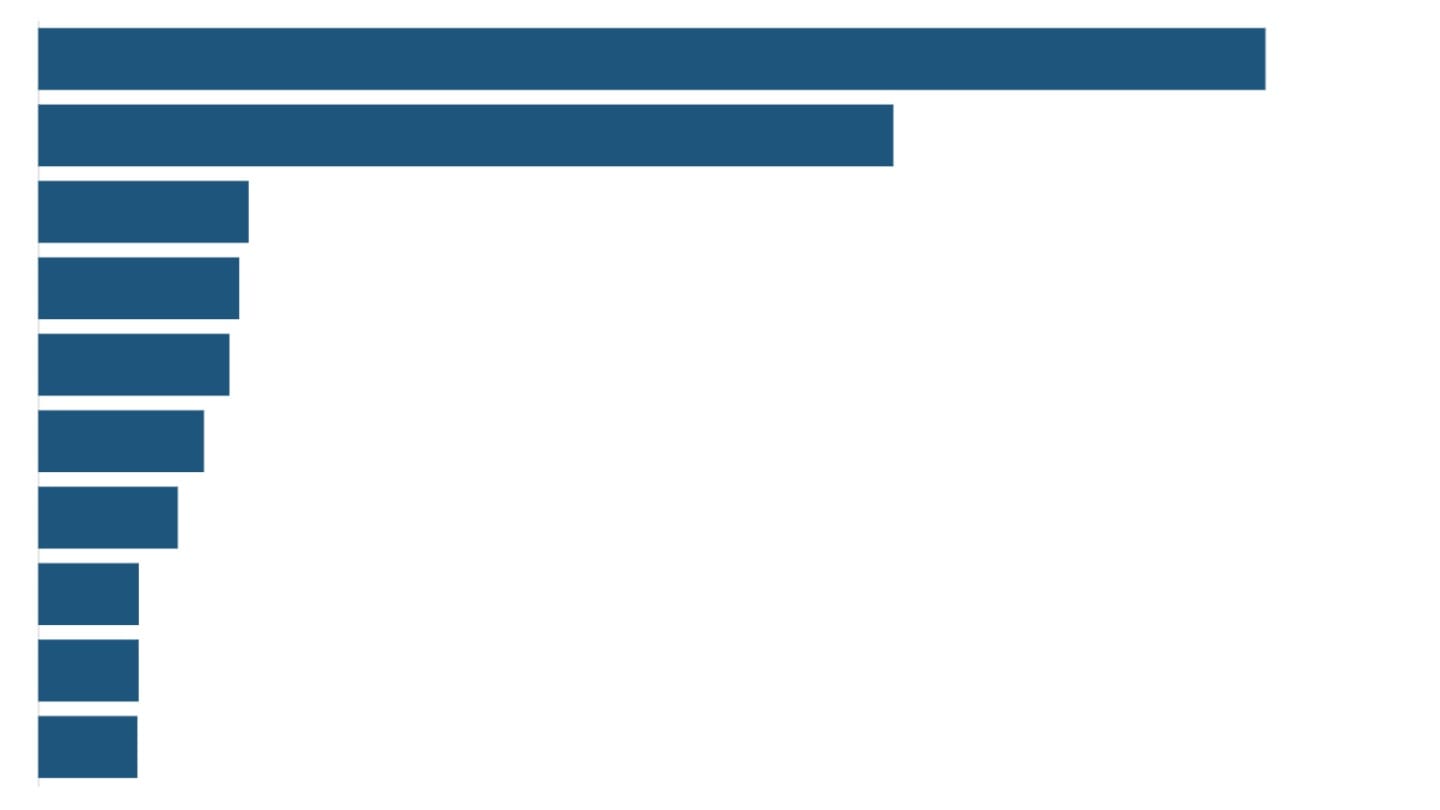
The IMD classifies annual rainfall into the following categories:
- Deficient (less than 90% of the LPA) and below-normal (90-96% of the LPA) indicating drier‑than‑usual conditions;
- Normal (96-104% of the LPA) represents the expected range;
- Above-normal (104-110% of the LPA) and excess (more than 110% of the LPA) signal wetter‑than‑usual years.
Overall, the distribution shows that more than half of all years fall within the normal or near-normal range, while roughly one-third of years experienced substantial departures from the long-term average. The presence of both deficient and excess years together accounting for nearly 30% of all years reflects the inherent variability of rainfall in India[10], with significant implications for agriculture and water resources.
Daily rainfall patterns
While annual rainfall provides a broad picture of India's climate, examining rainfall at a daily scale helps identify changes in the frequency, intensity and duration of rainfall events-factors that often have the most immediate impacts on agriculture, water management and disaster risk. A season with "normal" rainfall can still produce devastating floods if most of that rain falls in a few intense spells or cause crop failure if prolonged dry gaps occur between showers.
To capture this criticality, researchers rely on daily rainfall metrics that describe not just the quantity of rainfall, but also how it is distributed in time. These metrics are computed using thresholds standardised by the Expert Team on Climate Change Detection and Indices (ETCCDI)[11] to address the need for objective measurement and characterisation of climate variability and change by providing international coordination and standardised tools for climate analysis[12].
Daily rainfall metrics can be broadly classified into two categories - those that measure frequency of rainfall, and those that measure intensity of rainfall.
Frequency of rainfall
At the national level, the frequency of rainfall has remained essentially unchanged. Across most indicators, annual trends are weak or negligible, underscoring the dominance of natural variability over clear directional change at the national scale.
The average number of rainy days (days with ≥2.5 mm of rainfall) is roughly 40% of the year and has increased by only 1.3 days between the first half of the 20th century (1901-1959) and the recent period (1960-2025). The maximum length of a wet spell (consecutive rainy days) stands at about 100 days, while the longest dry spell (consecutive dry days) averages 67 days. Neither shows a statistically significant trend.
Intensity of rainfall
Rainfall intensity indicators include maximum daily rainfall, defined as the highest rainfall recorded in a single day in a year. The maximum daily rainfall in India averages 15.36 mm per day, with a range of 11.1-19.1 mm, and has increased only marginally by 0.15 mm over time.
Daily rainfall values reported at the national level using gridded data often appear smaller because they represent an area-weighted average depth across the entire country rather than the intensity of rainfall at any specific location. In a large and spatially diverse country like India, rainfall on any given day is localised, with some regions receiving heavy rainfall while many others remain dry. Thus, smaller daily values at the national scale are a consequence of spatial averaging over heterogeneous rainfall patterns, and may mask spatial distribution of rainfall.
Another indicator of intensity, the total precipitation on wet days - defined as the sum of rainfall received on all rainy days - which accounts for about 87% of annual rainfall, has remained stable with virtually no change between early and recent periods.
Overall, these metrics suggest that at the national scale, rainfall frequency and intensity have remained largely unchanged, with spatial averaging smoothing out localised extremes. Analysis of the data at an annual level suggests a system characterised by stability in averages but substantial year-to-year variability, where individual years often deviate markedly from the mean.
[1] Challenges and Opportunities in Rainfed Agriculture (2025), Singh et. al., ICAR-Central Research Institute for Dryland Agriculture.
[2] In a gridded rainfall dataset at a spatial resolution of 0.25°, the country is divided into grid cells of roughly 25 × 25 km. Each grid cell represents an area-averaged estimate derived from multiple nearby rain gauge stations rather than a single-point observation. These datasets are constructed from a dense observational network, with quality control procedures applied to remove erroneous values and ensure temporal consistency before generating the gridded surface.
[3] While the national average displays limited systematic change when viewed over broad timescales, regional and seasonal patterns exhibit significant trends including declines in monsoon rainfall in parts of central and western India and increases in rainfall extremes in other regions.
[4] Tests of statistical significance for rainfall trends such as the Mann-Kendall (MK) test have been applied to determine whether observed changes over time are likely due to natural variability or represent a meaningful long-term trend. The MK test is widely used for analysing consistent increases or decreases over time without assuming a specific pattern in the data.
[5] The benchmark for what constitutes a "normal" year has been periodically reduced as the climate changes. The current baseline period is 1971‑2020, which replaced the 1961‑2010 period in 2022. As a result, the all‑India annual rainfall normal decreased from 1176.9 mm to 1160.1 mm (a reduction of 16.8 mm or 1.4%).
[6] El Niño and La Niña are opposite phases of the El Niño-Southern Oscillation (ENSO), a climate pattern in the tropical Pacific Ocean. El Niño (warmer ocean conditions) is generally associated with weaker monsoons and below-normal rainfall in India, while La Niña (cooler conditions) tends to strengthen monsoon rainfall. ENSO is a major driver of year-to-year variability in Indian rainfall, though its effects can vary depending on regional and ocean-atmosphere conditions.
[7] Parliament Question: Impact of La Niña on Climate Patterns (2025), Ministry of Earth Sciences, Press Information Bureau.
[8] Frequently Asked Questions (FAQs) on Monsoon, Climate Research and Services, Pune, India Meteorological Department (IMD).
[9] Because the annual LPA has been reduced (dropping by roughly 16.8 mm in the latest revision compared to the earlier normal of 1176.9 mm based on the 1961-2010), a year that might have been classified as "below normal" in the early 20th century may now be classified as "normal" or "above normal" because the average it is being measured against has decreased.
[10] Variability of Summer Monsoon Rainfall in India on Inter-Annual and Decadal Time Scales (2013), Joseph et al., Atmospheric and Oceanic Science Letters / Taylor & Francis.
[11] The Expert Team on Climate Change Detection and Indices (ETCCDI) is a joint international initiative sponsored by the World Meteorological Organization (WMO) and other partner bodies. It has defined a core set of 27 standardised indices for temperature and precipitation extremes, including metrics such as consecutive dry days and maximum five-day rainfall, that have become the global standard for monitoring changes in climate extremes and are widely used in IPCC assessments.
[12] Indices and Data (n.d.), Expert Team on Climate Change Detection and Indices (ETCCDI), World Climate Research Programme / CLIVAR.(n.d.), Expert Team on Climate Change Detection and Indices (ETCCDI), World Climate Research Programme / CLIVAR.