Welcome to The Roundup, Data For India's new monthly newsletter. I am Arpit, Data For India’s Product Lead. Each month I'll bring you the latest work, new platform features and major updates from our work, right in your inbox.
Here is what’s in the first issue: a new look at India’s climate data, some reading recommendations, a platform feature for you to try, and one data point worth sitting with. The Roundup will be in your inbox on the last Friday of every month.
The Spotlight
A clearer view of India's climate records
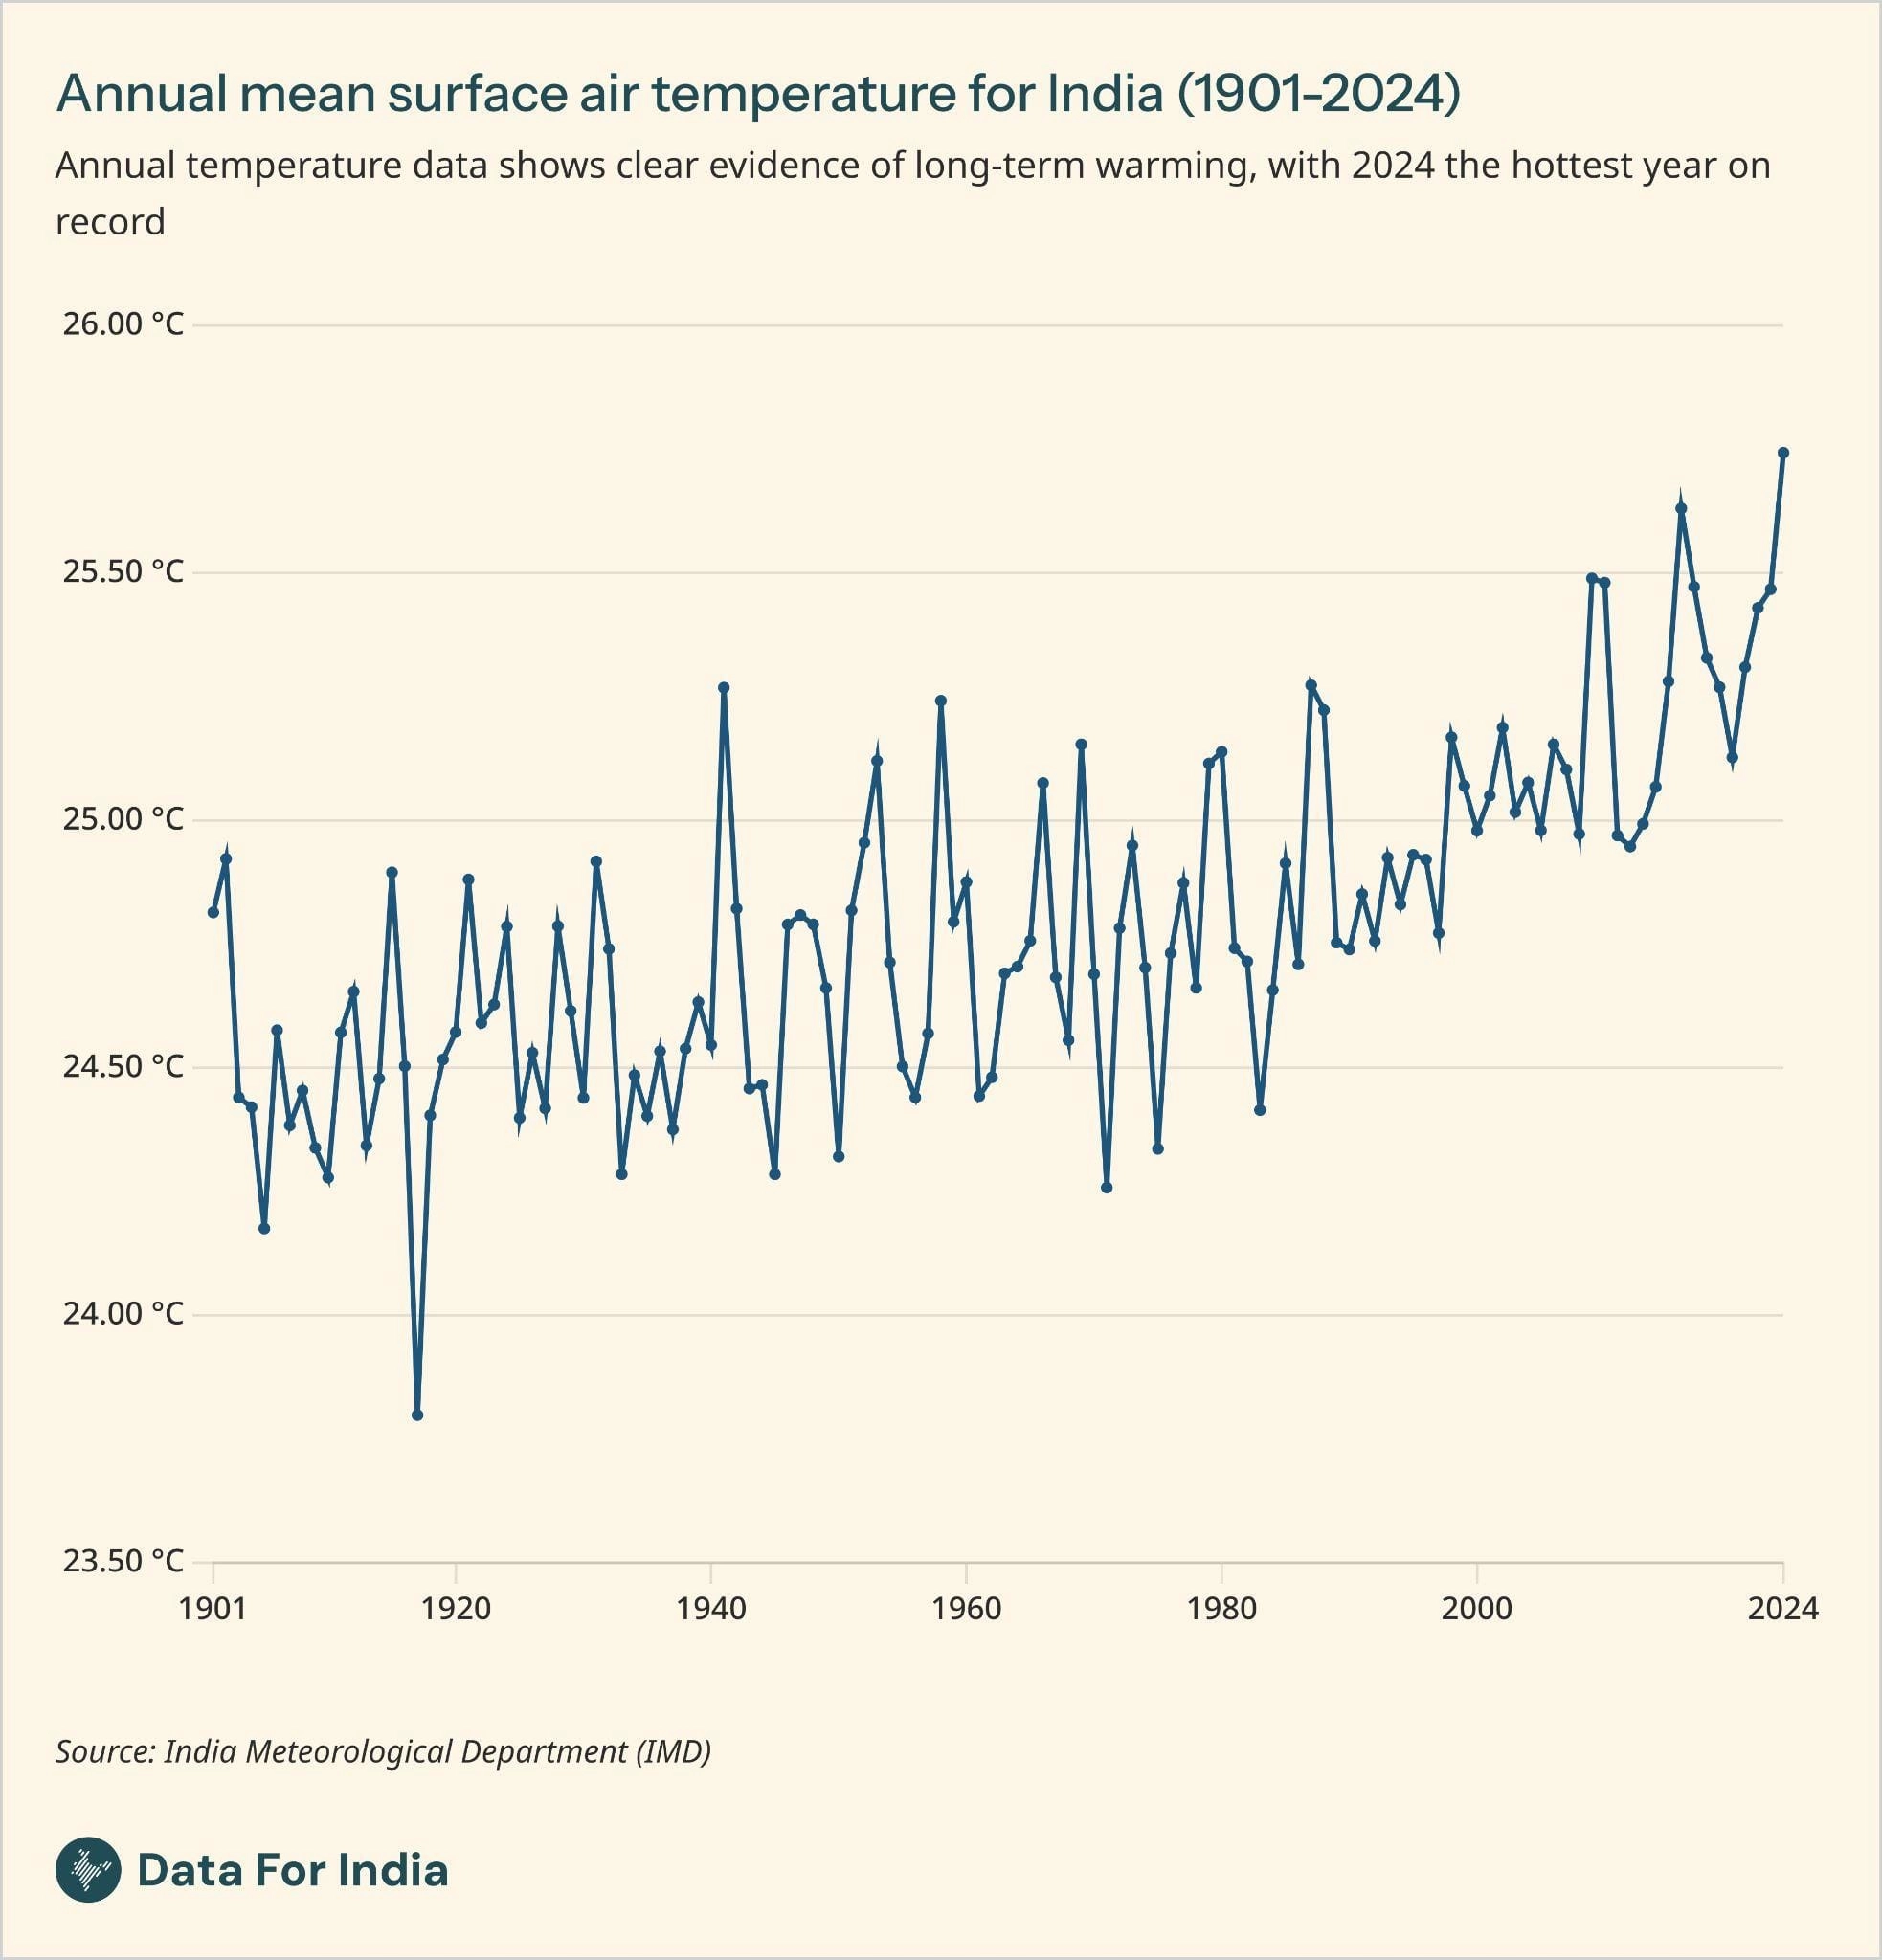
Most climate writing leans on modelled data, adding a layer of estimation between what's actually been measured and readers’ understanding. We at Data For India worked directly with raw India Meteorological Department (IMD) data on recorded temperatures dating back to 1901 to try and answer a simple question - how have temperatures in India changed over time?
Our colleague Juhi Chatterjee's analysis lands on one striking number: between 1901 and 2024, India's mean temperature has risen by roughly 0.9°C, with 2024 being the hottest year on record. For context, the Intergovernmental Panel on Climate Change (IPCC) estimates that each additional 0.1°C increases the intensity and frequency of heatwaves, rainfall extremes and droughts.
To understand what is driving warming in India, read Juhi’s piece on temperature trends in India.
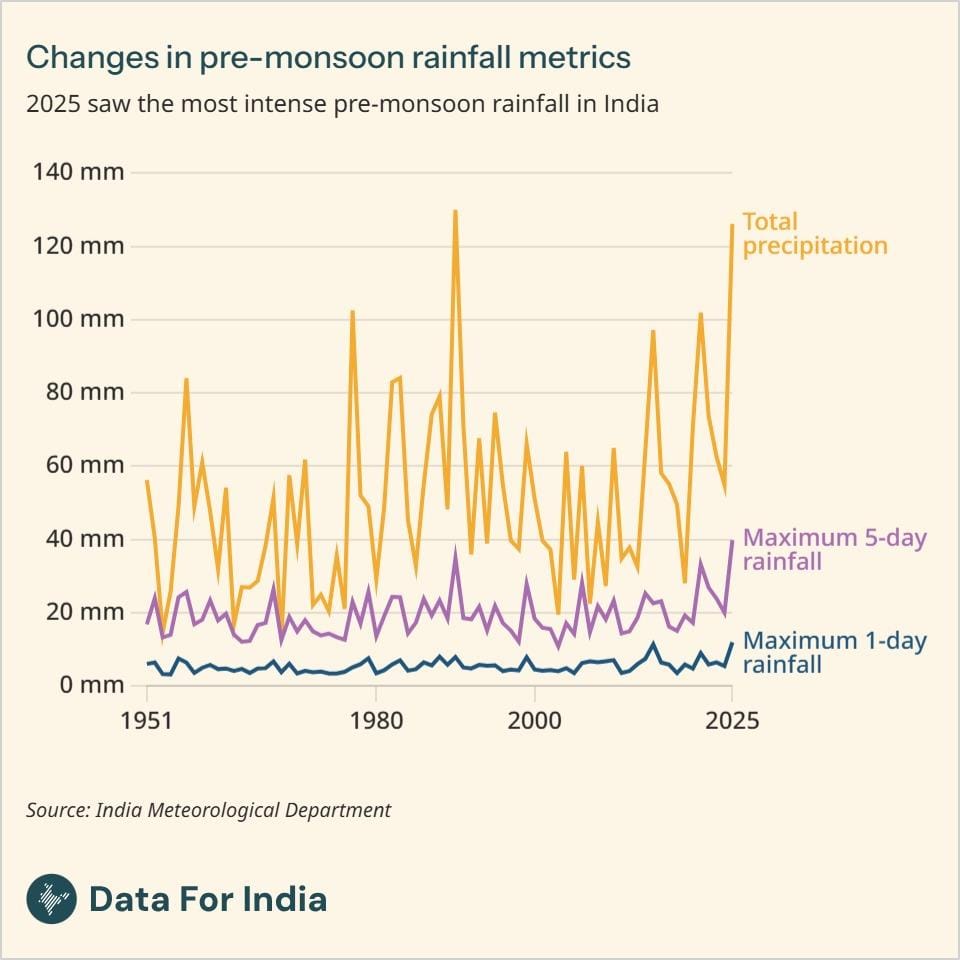
Going beyond temperature, our climate work goes on to look at rainfall – a subject central to India's agriculture and economy. Drawing from over a century of IMD data, Juhi looks at how rainfall patterns have shifted. While rainfall in India appears to be stable over time at the aggregate level, there is significant variation in seasonal rain. In particular, the pre-monsoon and post-monsoon seasons have seen the sharpest shifts.
New On The Platform
- Availability of healthcare professionals. India sits just below the WHO threshold of 44.5 health workers per 10,000 people. Our colleague Nileena Suresh’s analysis shows, the headline number hides a rural-urban gap, uneven nurse-to-doctor ratios across states, and the gulf between professionals who are registered and those actively practising.
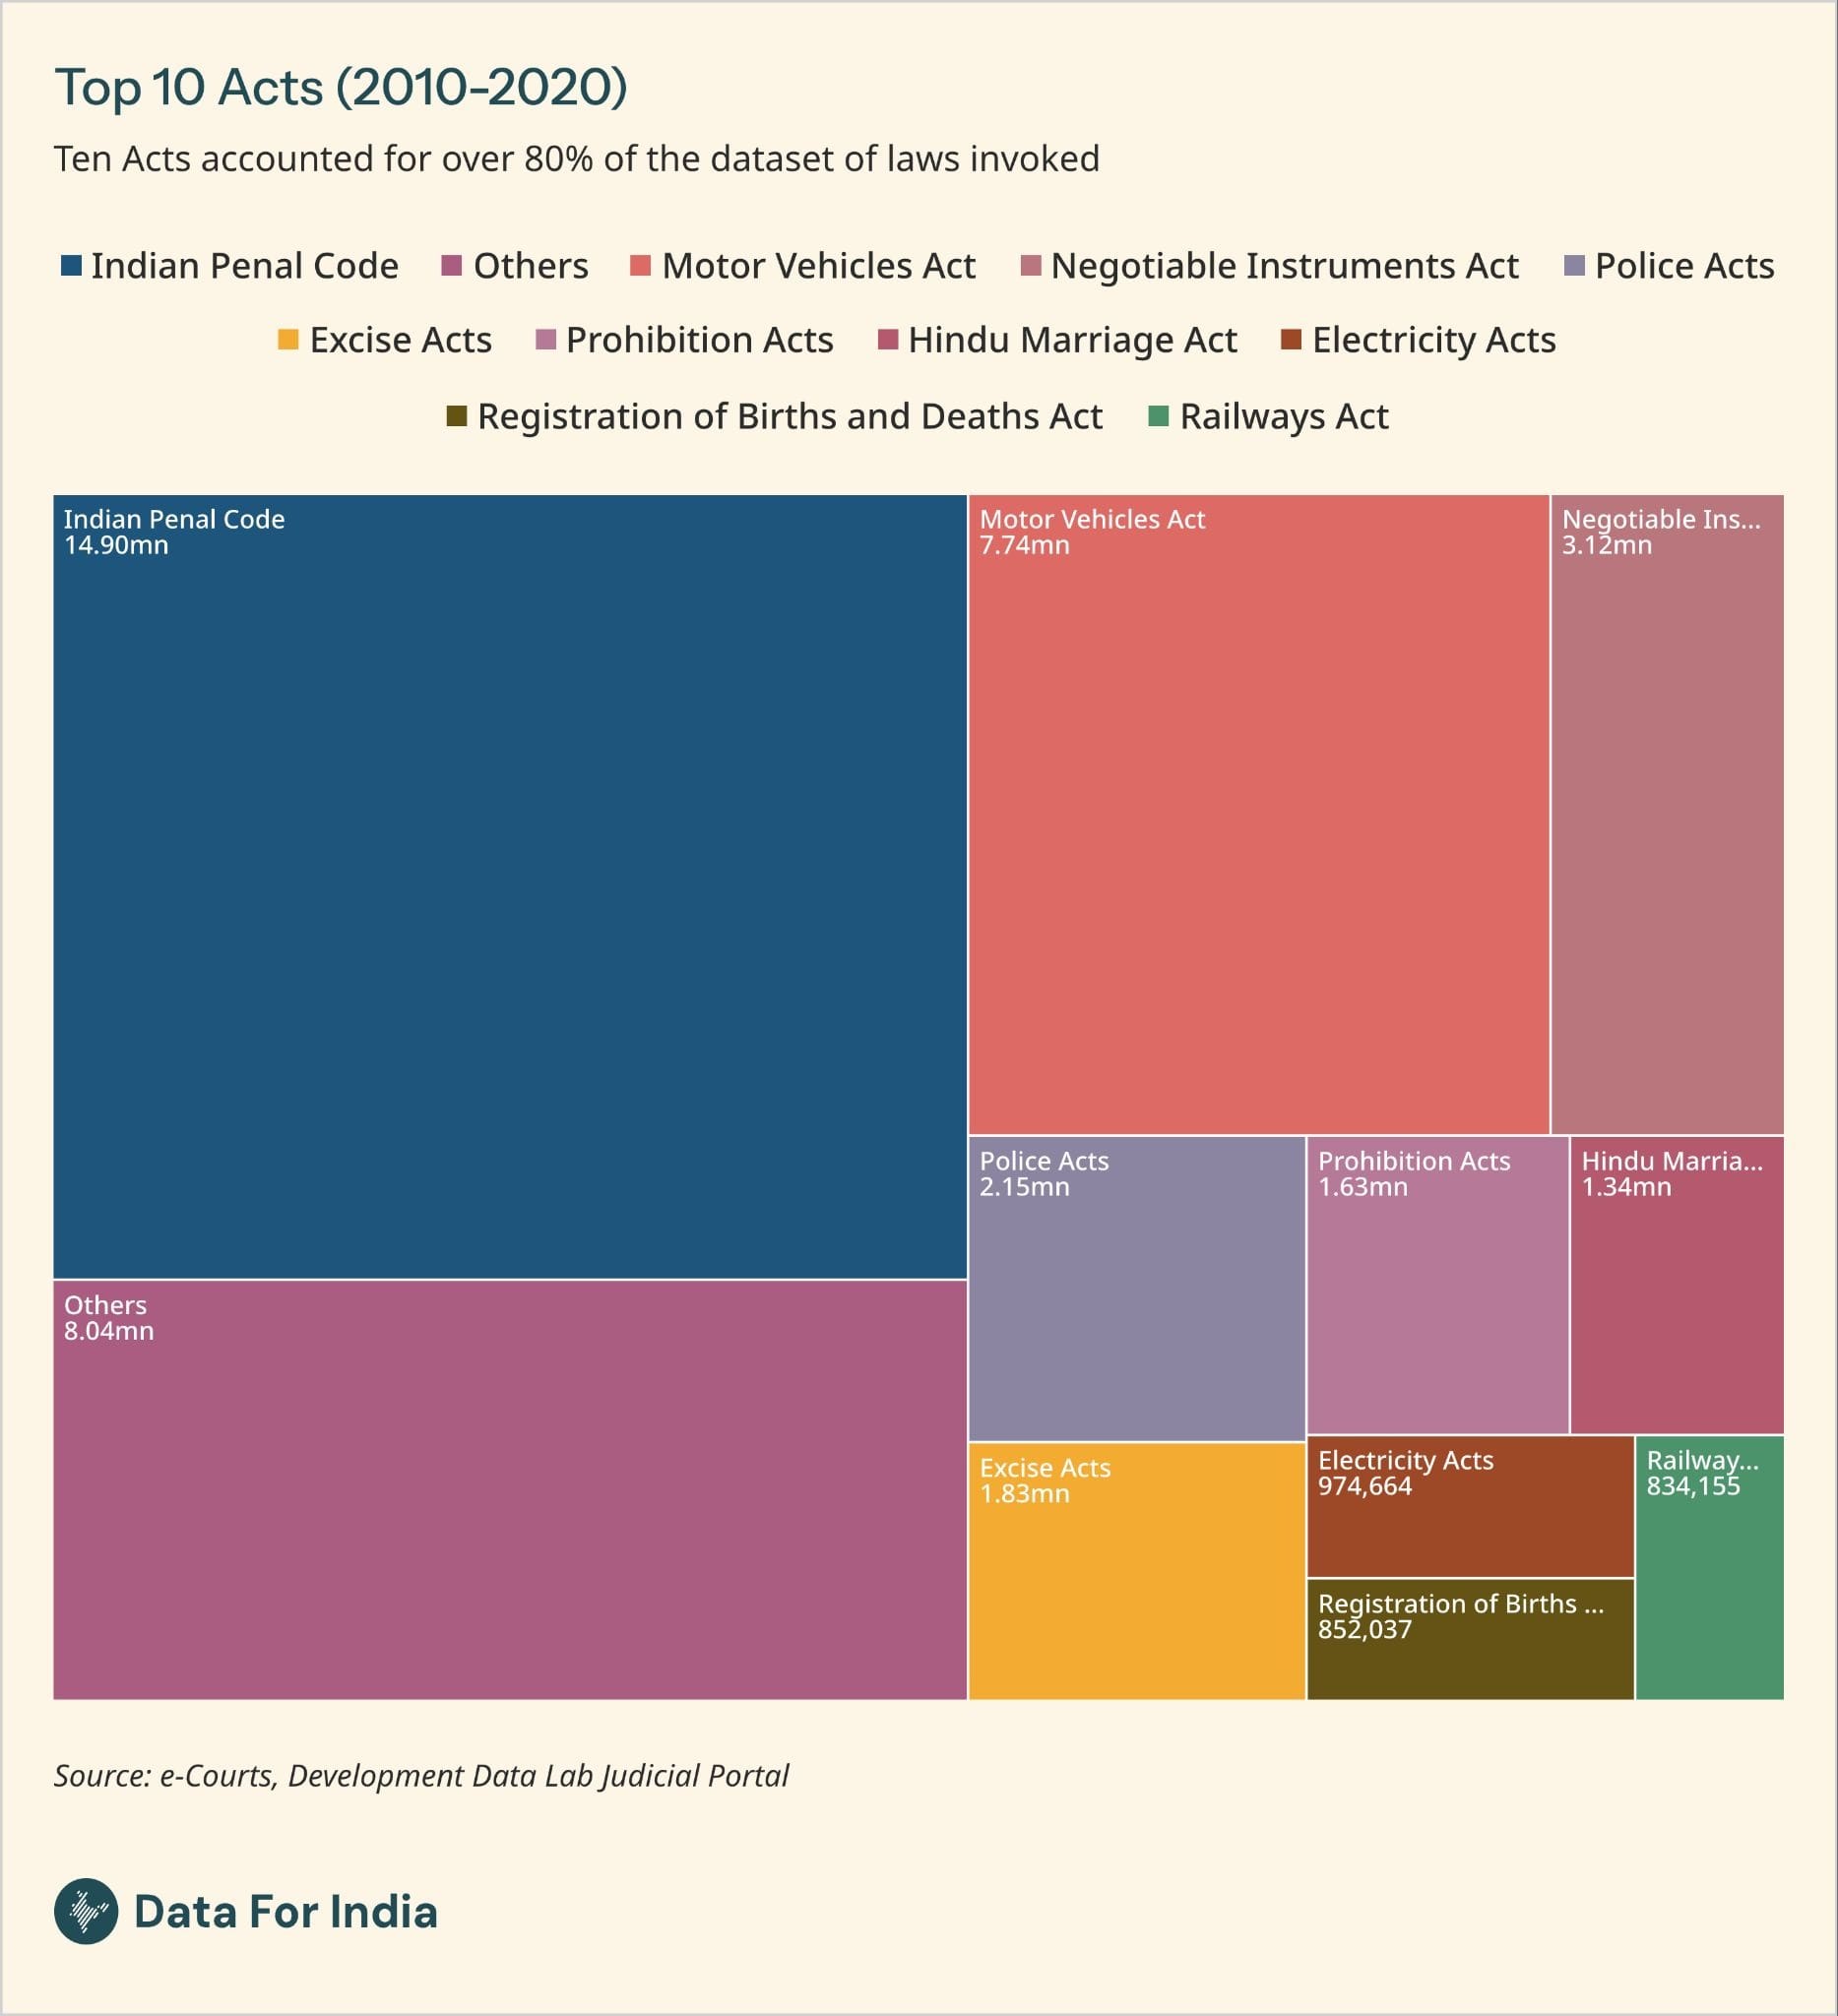
- Judicial pendency in India. There are 54 million cases pending before India's judiciary, and every year more cases are filed than disposed of. Pendency is usually shared as a single headline number with very little disaggregation. Ameya Bokil's piece advances our understanding of what sits behind the pile of cases and how the trends are moving.
- Fuel for cooking. 60% of Indian households use LPG as their primary source of fuel for cooking. But our founder Rukmini S finds that a third of India’s households still rely on firewood as their primary source of cooking fuel, concentrated primarily in poorer or rural households, and the eastern states.
One Thing To Try
Take our charts with you
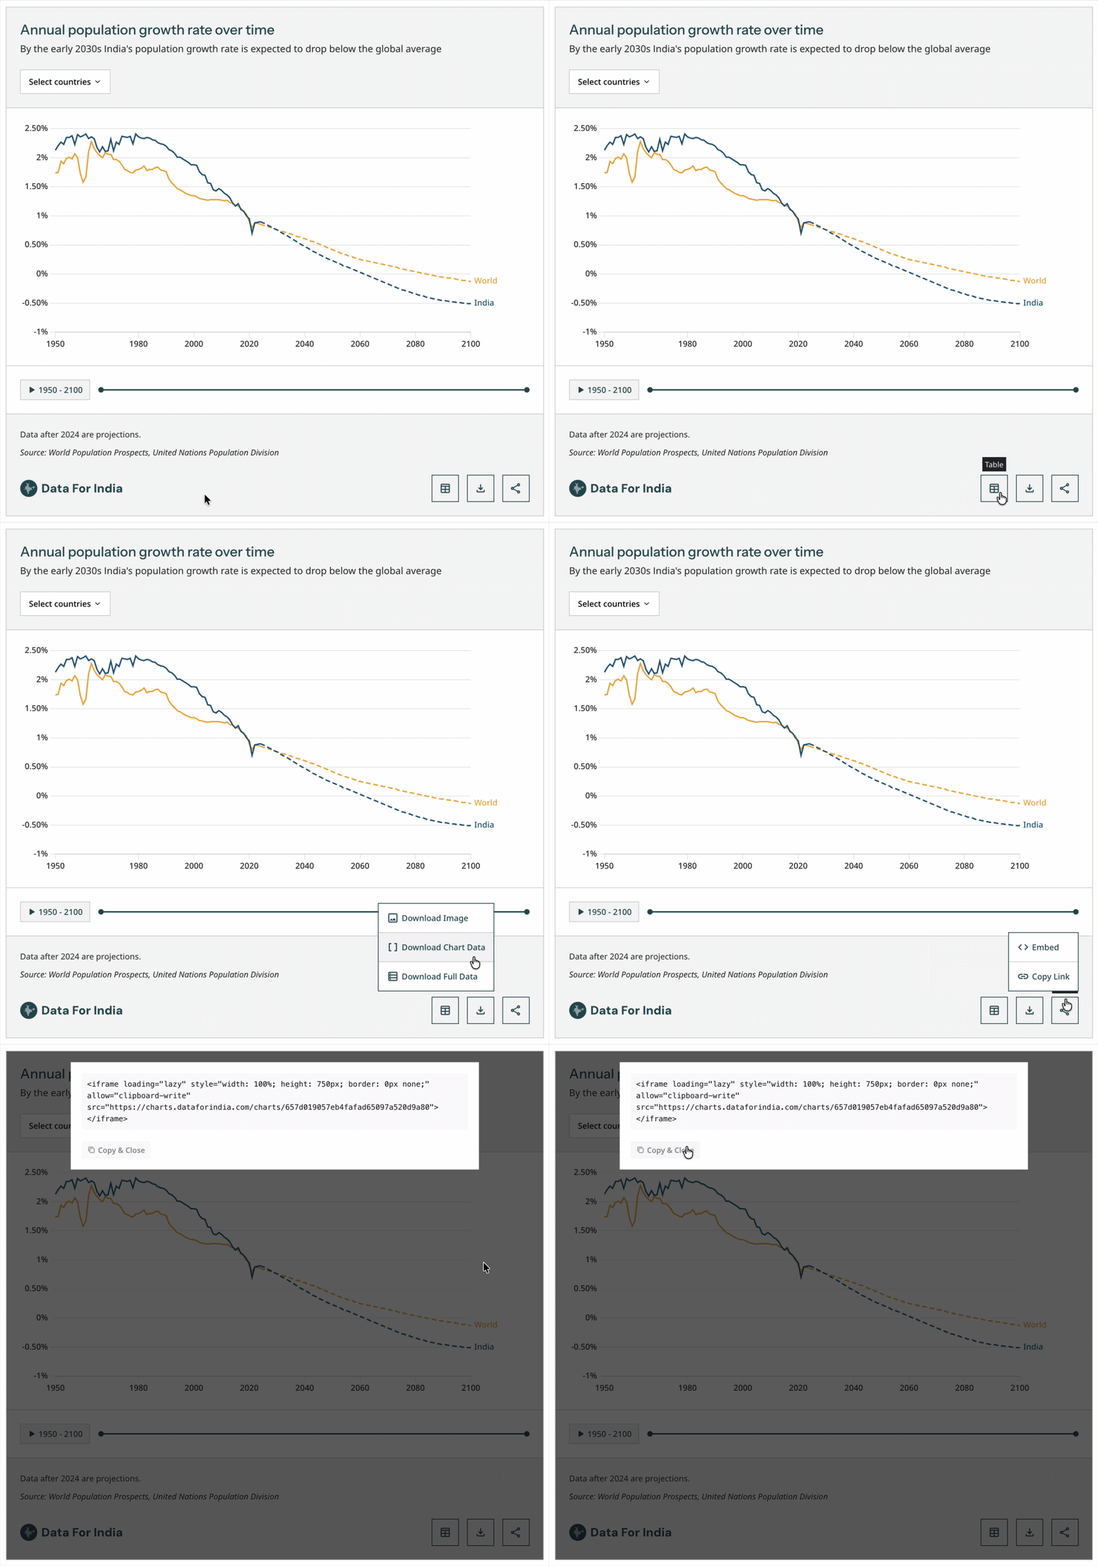
Did you know that you could reuse every chart on dataforindia.com for your website or platform of your choice? Every chart on the platform contains a menu of options at the bottom right corner:
- Access the data behind any chart. Open the table view to explore the numbers directly, or download them as a CSV. “Download Chart Data” for what's currently in view on the chart, “Download Full Data” for the complete dataset.
- Reuse the chart itself. Download a high-resolution image, copy a share link, or embed the chart on your own site or platform of choice. Embeds keep the interactivity and stay in sync with the underlying data.
If you do reuse our chart, don’t forget to cite us. We are excited to find out how you are using our work to advance understanding of India.
Conversations We Joined
- At the National Conference on State Finance Commissions in Pune in January, Data For India’s Head of Research, Pramit Bhattacharya, joined a breakout panel on data challenges, flagging the need to examine the quality and autonomy of state statistical systems.
- Nileena Suresh, our writer on health and gender, spoke at IIIT-Delhi's Digital Delhi Conclave in early February, opening the plenary Personal is Political: Gender in Intimate Spaces with data talking about women's work, infrastructure, health and safety in Indian homes.
- Apoorv Anand and Arpit Arora conducted a workshop at SolveCon 2026 later in February, for over 60 young people in Bengaluru, where charts from the Data For India platform anchored conversations on understanding India better through data.
Where Our Work Travelled
- BBC referenced our piece on bottled water in their coverage of India's summer water crunch.
- Observer Research Foundation cited our work on internal migration in a policy report on global mobility of Indian emigrants.
- The India Forum drew on our Periodic Labour Force Survey explainer to estimate the worker population exposed to silica dust in India.
- The Wire republished our piece about salaried jobs in India for their readers.
Talking Point
One chart worth sitting with this month, from a Data For India team member.
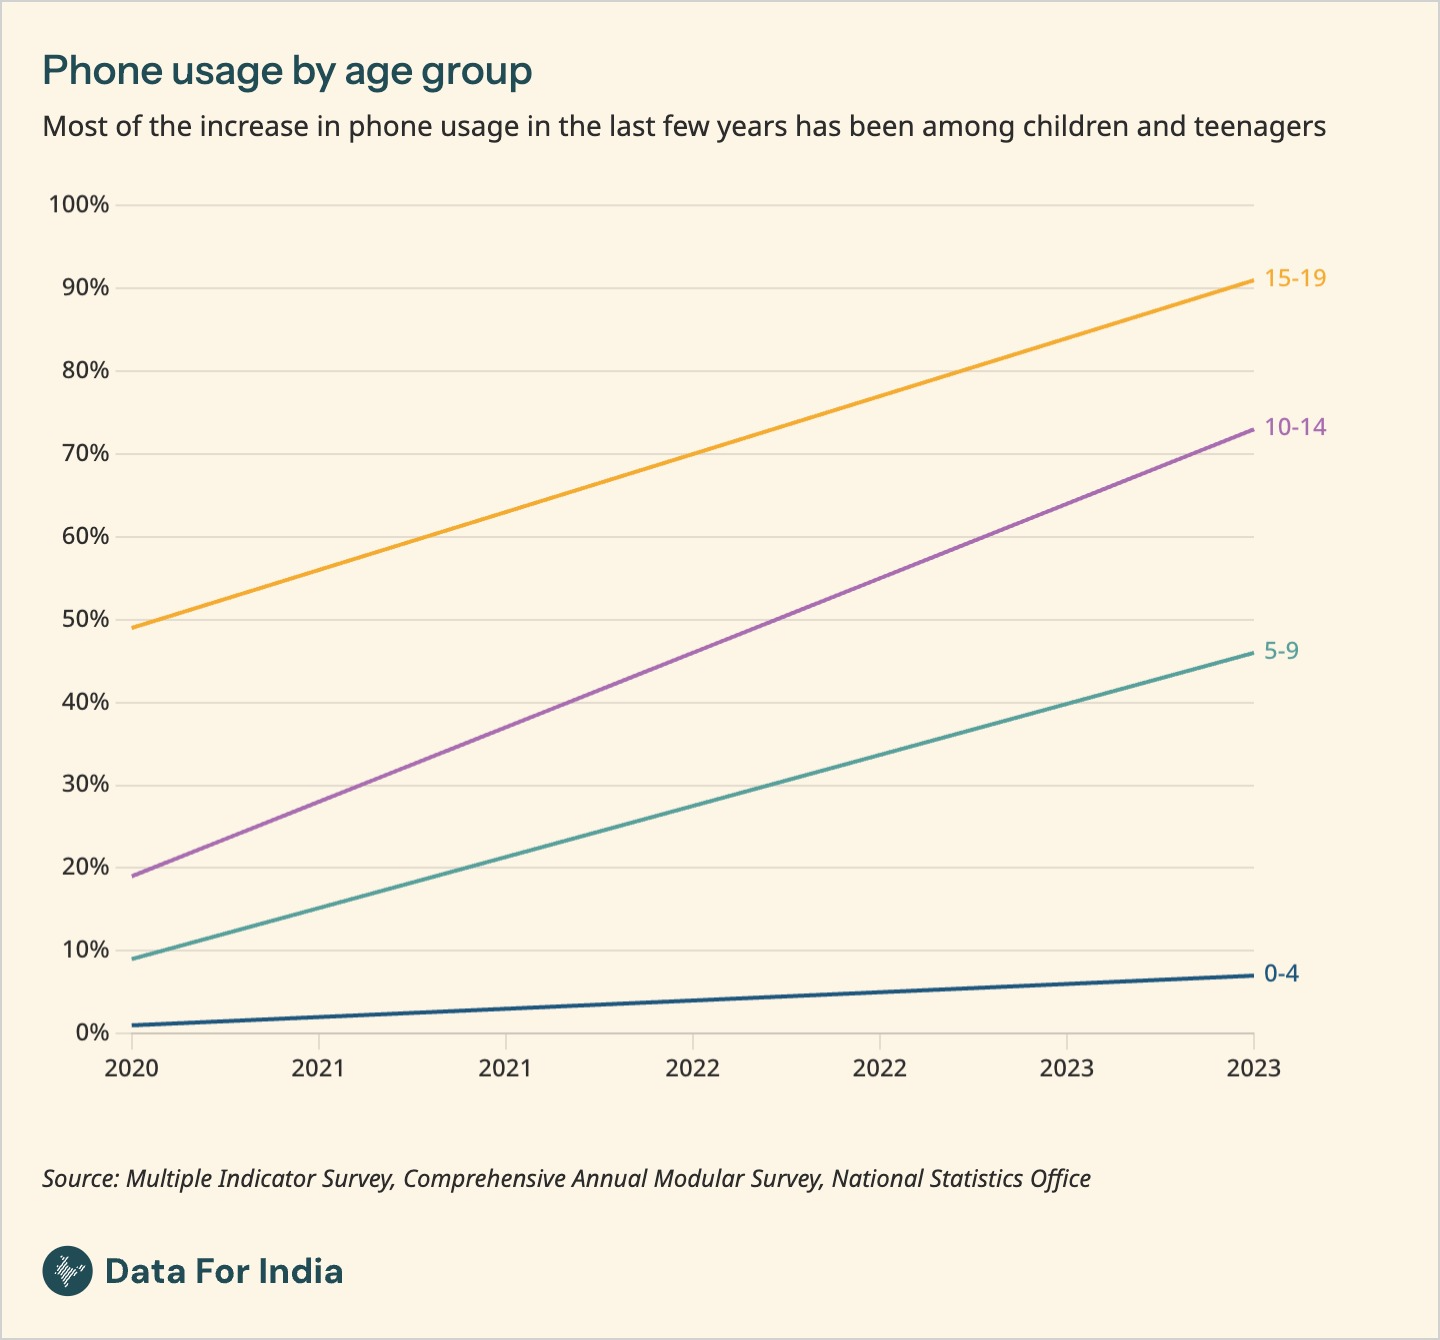
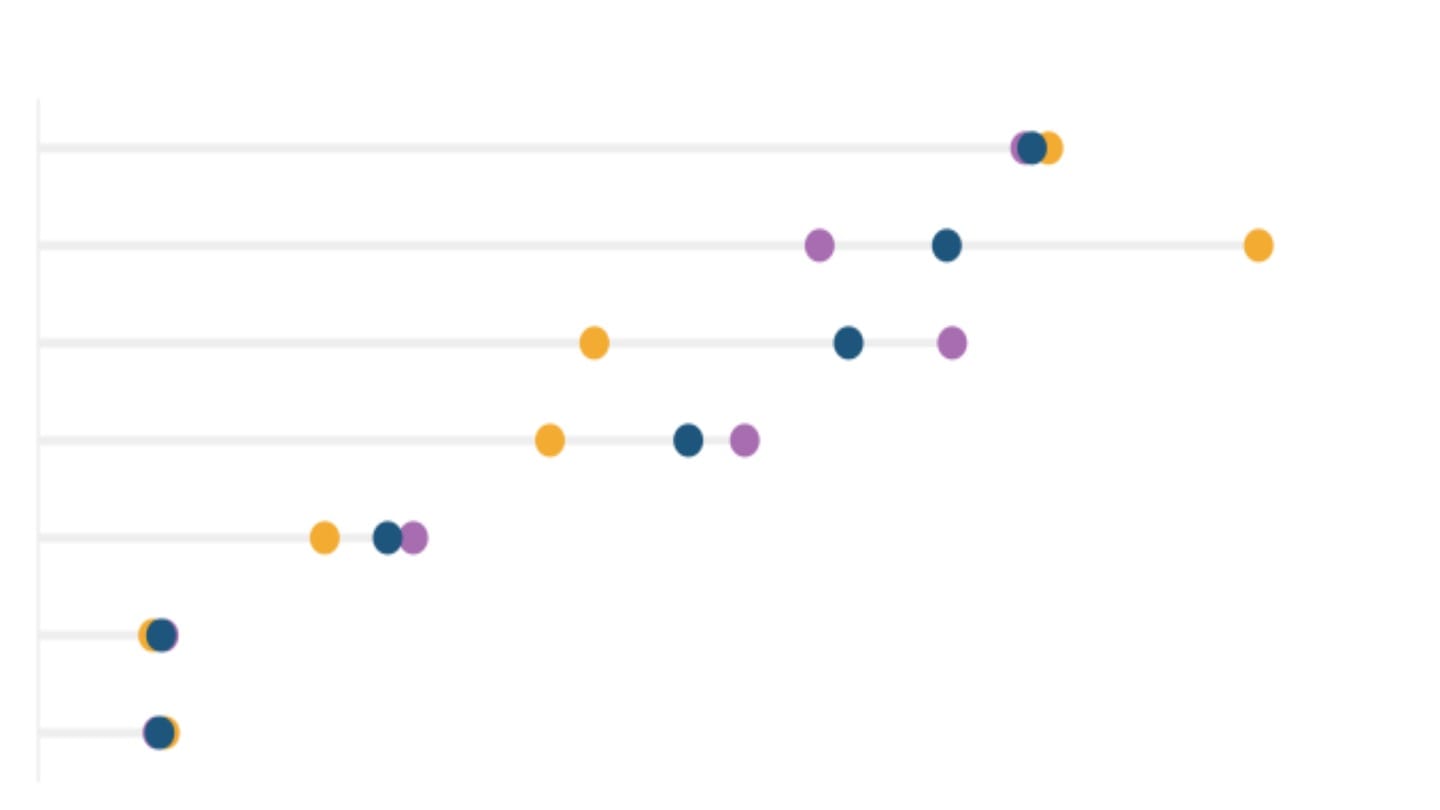
In recent years, children and teenagers have contributed the most to the rise of mobile phone usage in the country. The numbers might tell a positive story from the perspective of access to mobile phones and, by extension, the internet. What remains to be seen is how this trend transforms our social fabric, especially at a time when many parents (at least around me) use their phones as a substitute for time and engagement with their children.
- Apoorv Anand, Head of Data Operations
That's it for the first edition of The Roundup from Data For India. We will be back again on the last Friday of next month.
If something from this month’s edition caught your eye or helped you better understand India through data, write to us by replying to this email or reaching us at info@dataforindia.com.