Welcome back to The Roundup, Data For India's monthly newsletter bringing you our latest work, new features and major updates, right in your inbox.
In this month’s edition: a deeper look at India’s informal sector, what India’s prison data reveals, and some upcoming events to meet the Data For India team.
The Spotlight
How big is India’s informal sector?
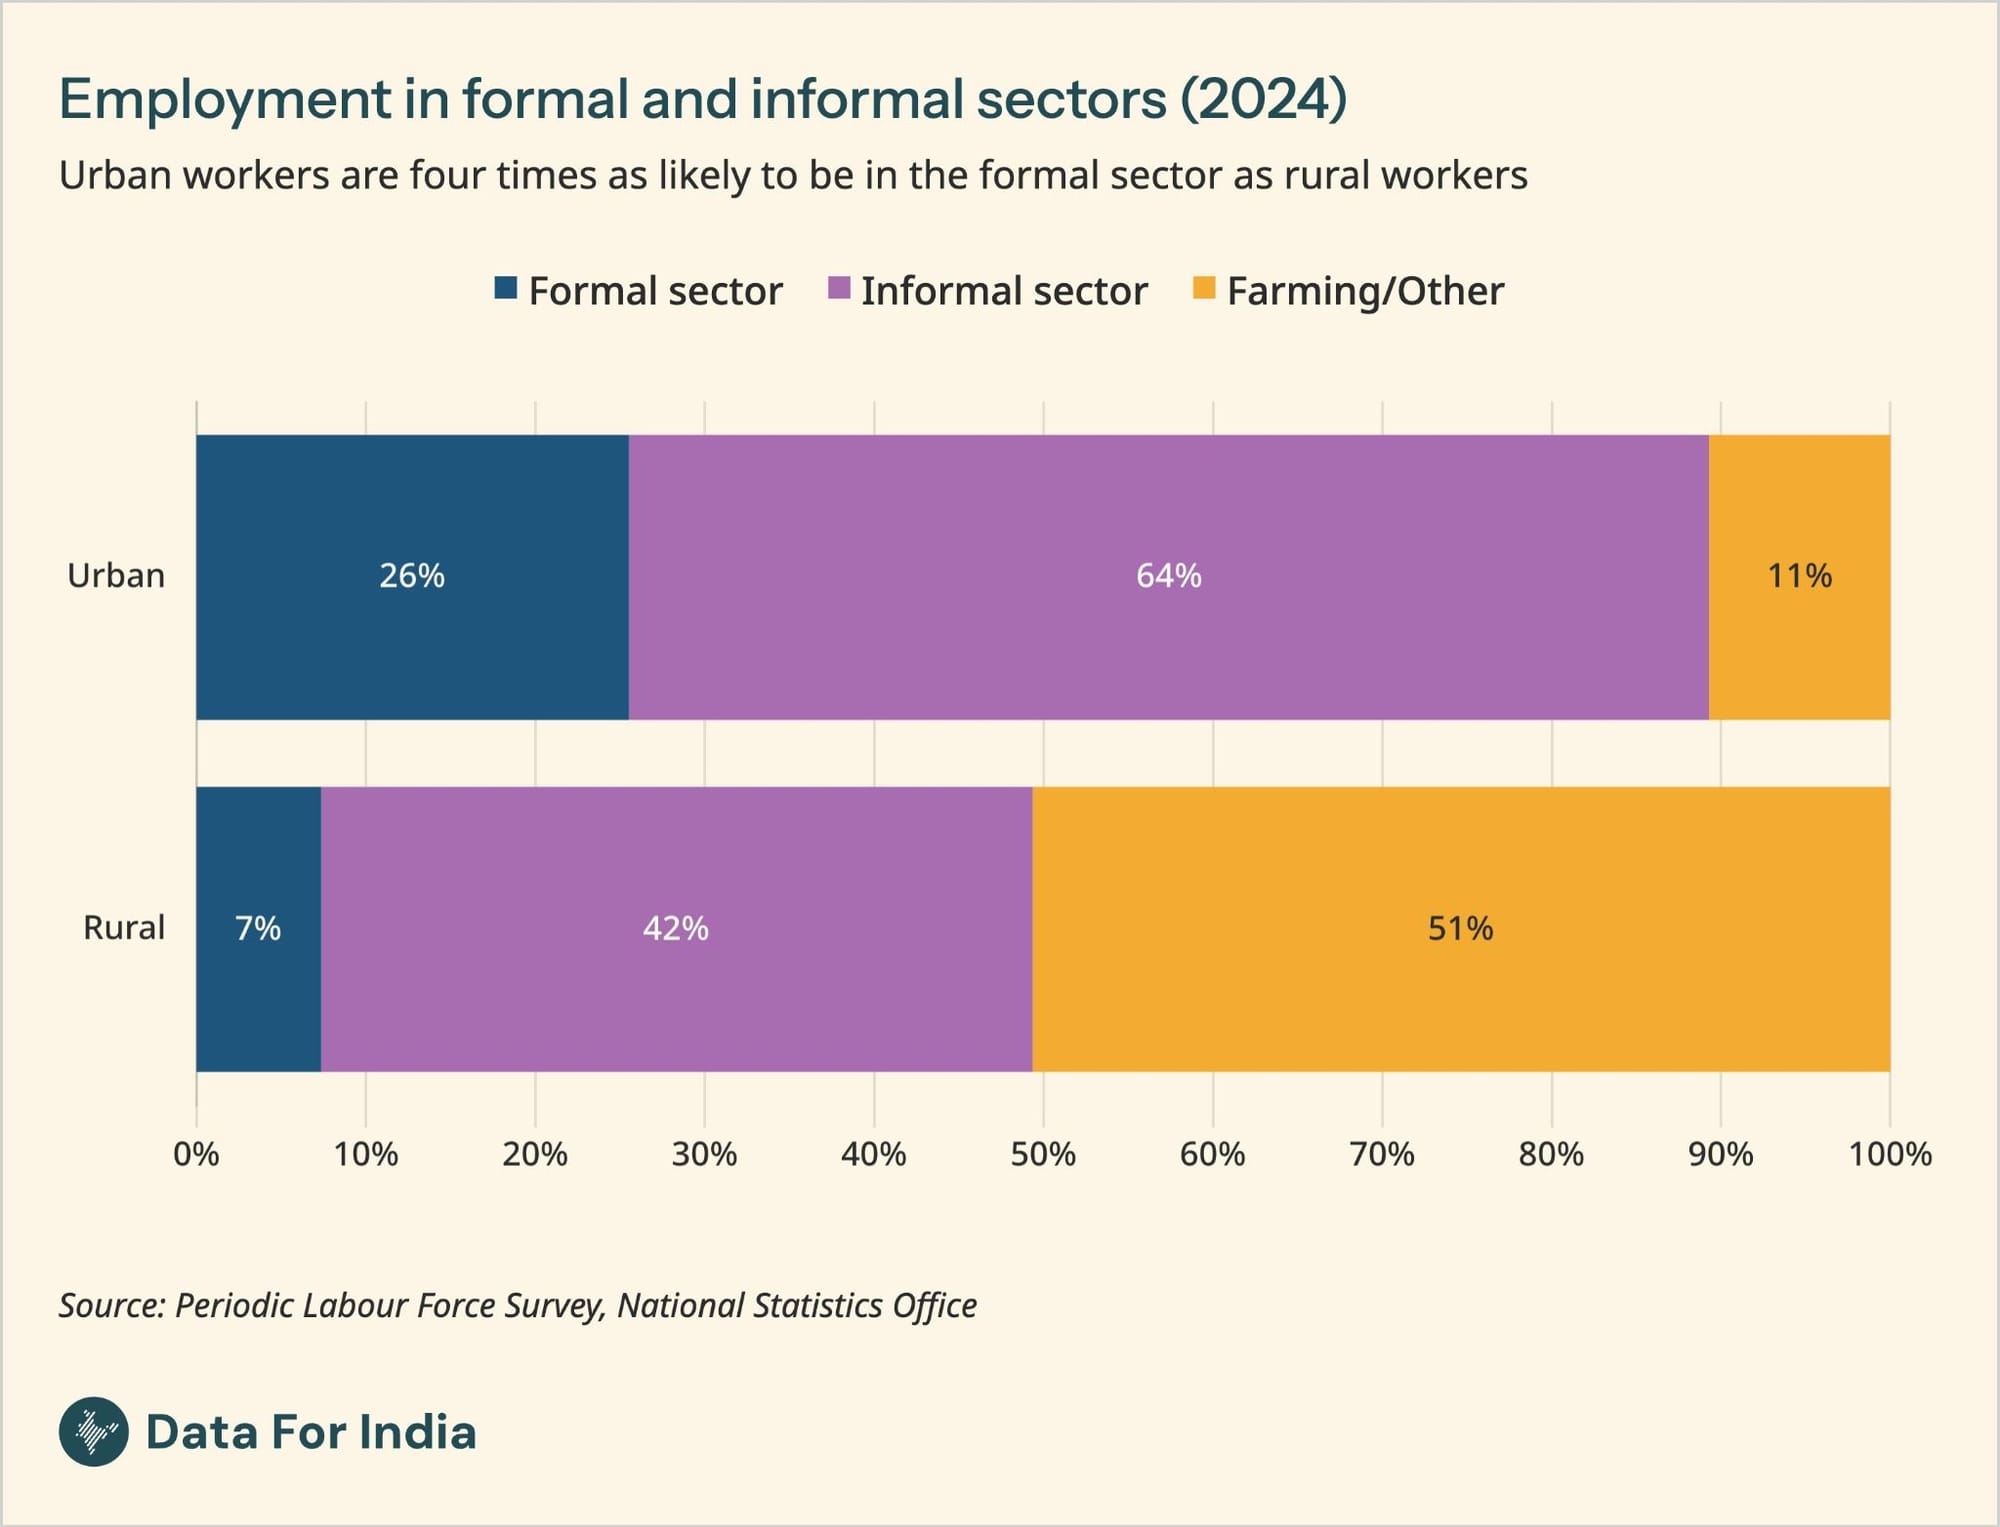
India’s informal sector employs most of the workforce and has remained large over the past two decades despite economic growth. Defining it should be straightforward; however, in practice its meaning shifts depending on whether you focus on enterprises or workers, and on what India’s labour surveys capture.
In both international labour statistics and India’s national statistics, there are two main approaches. One classifies enterprises as formal or informal based on their production characteristics. The other classifies workers as formal or informal based on their working arrangements. Using India’s official labour statistics, Abhishek Waghmare applies both lenses to measure informality, and to ask whether formalisation is really growing.
Read the series in order: the sizing analysis on how big India’s formal sector really is, the composition of India’s informal sector, and dive deeper into the methodology of how India’s informal-sector is measured.
New On The Platform
- India's prison population. India has one of the world’s largest prison populations. However, most people in Indian prisons have not been convicted of a crime. Ameya Bokil maps who is behind bars, which states drive this trend and why India has so many undertrials.
- Is India accurately counting births and deaths? Correct estimation of births and deaths is essential to forecast population growth and for planning. Yet the datasets behind these estimates are imperfect. Nandlal Mishra examines different approaches to estimating births and deaths in India, their successes and shortcomings, and suggests when each might be better to use.
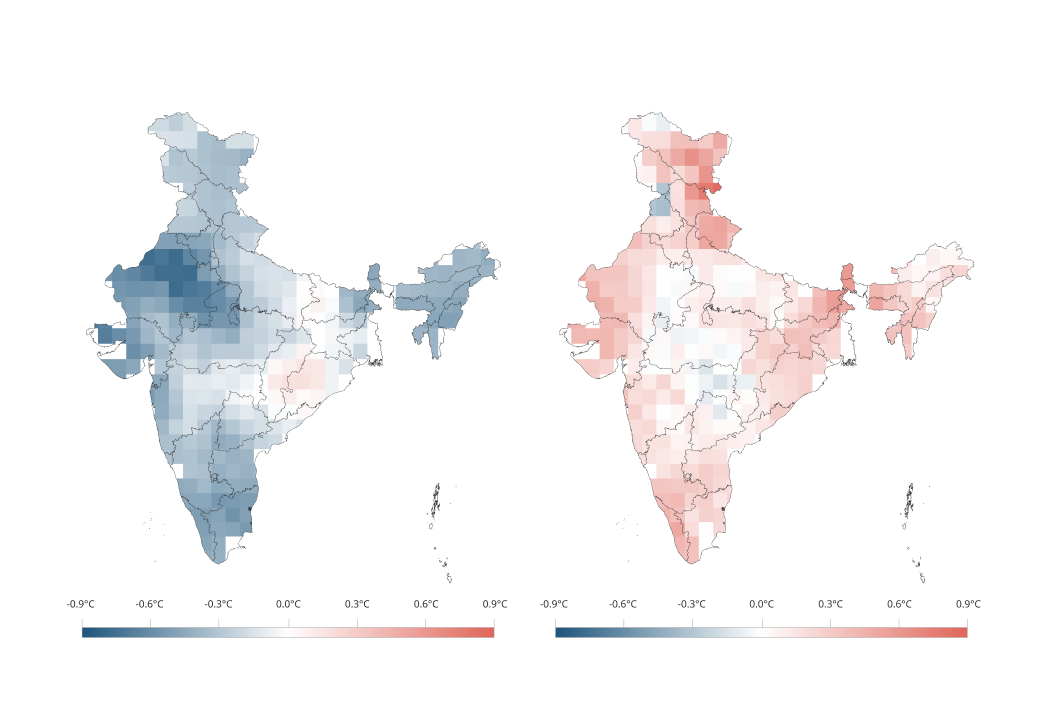
- Regional temperature trends in India. Despite a clear national warming trend, regions across India are seeing temperature changes in very different ways. Some of the largest shifts are being felt in the most ecologically sensitive areas. Juhi Chatterjee analyses these temperature variations and anomalies, zooming in on regional warming patterns.
One Thing To Try
Search smarter on Data For India
You might often visit the Data For India platform with a specific question or query in mind. The best place to start is the search bar on the homepage, or in the header navigation at the top right of every other page. A few small tricks can help you find what you need faster:
- Search for the exact terms you care about. Try both broad terms (e.g. labour) and specific ones (e.g. labour force participation, LFPR).
- Use quotes for exact phrases. Searching for "household consumption expenditure survey" is often more precise than searching without quotes.
- Try a couple of synonyms. If prisons does not get you there, try incarceration; if heat doesn’t, try temperature.
- Start narrow, then broaden. If you don’t find what you need, remove the quotes or drop a word and try again.
Beyond finding a single piece, search is also a good way to explore a broader theme. It will surface related reads, plus authors who have written across those themes.
Conversations We Joined
- Our founder, Rukmini S., spoke with officer trainees at the National Statistical Systems Training Academy (NSO, MoSPI) in Delhi, about the data MoSPI collects, how it is used by Data For India and others, its impact, what works well, and what could be improved.
- Rukmini S., Ameya Bokil, and Arpit Arora spoke with students and faculty at the National Law School of India University in Bengaluru, sharing Data For India’s work, how we approach legal data and research in our Law vertical, and introducing them to the Data For India platform.
Upcoming
- VizChitra 2026. Arpit Arora and Rukmini S. from the Data For India team will be at India’s premier data visualisation conference in Bengaluru on Saturday, 4 July. Come find us there.
- Pint of View. Rukmini S. is giving a lecture over drinks on What Data Can and Cannot Tell Us About Modern India in Bengaluru on Sunday, 5 July. Get your tickets.
Where Our Work Travelled
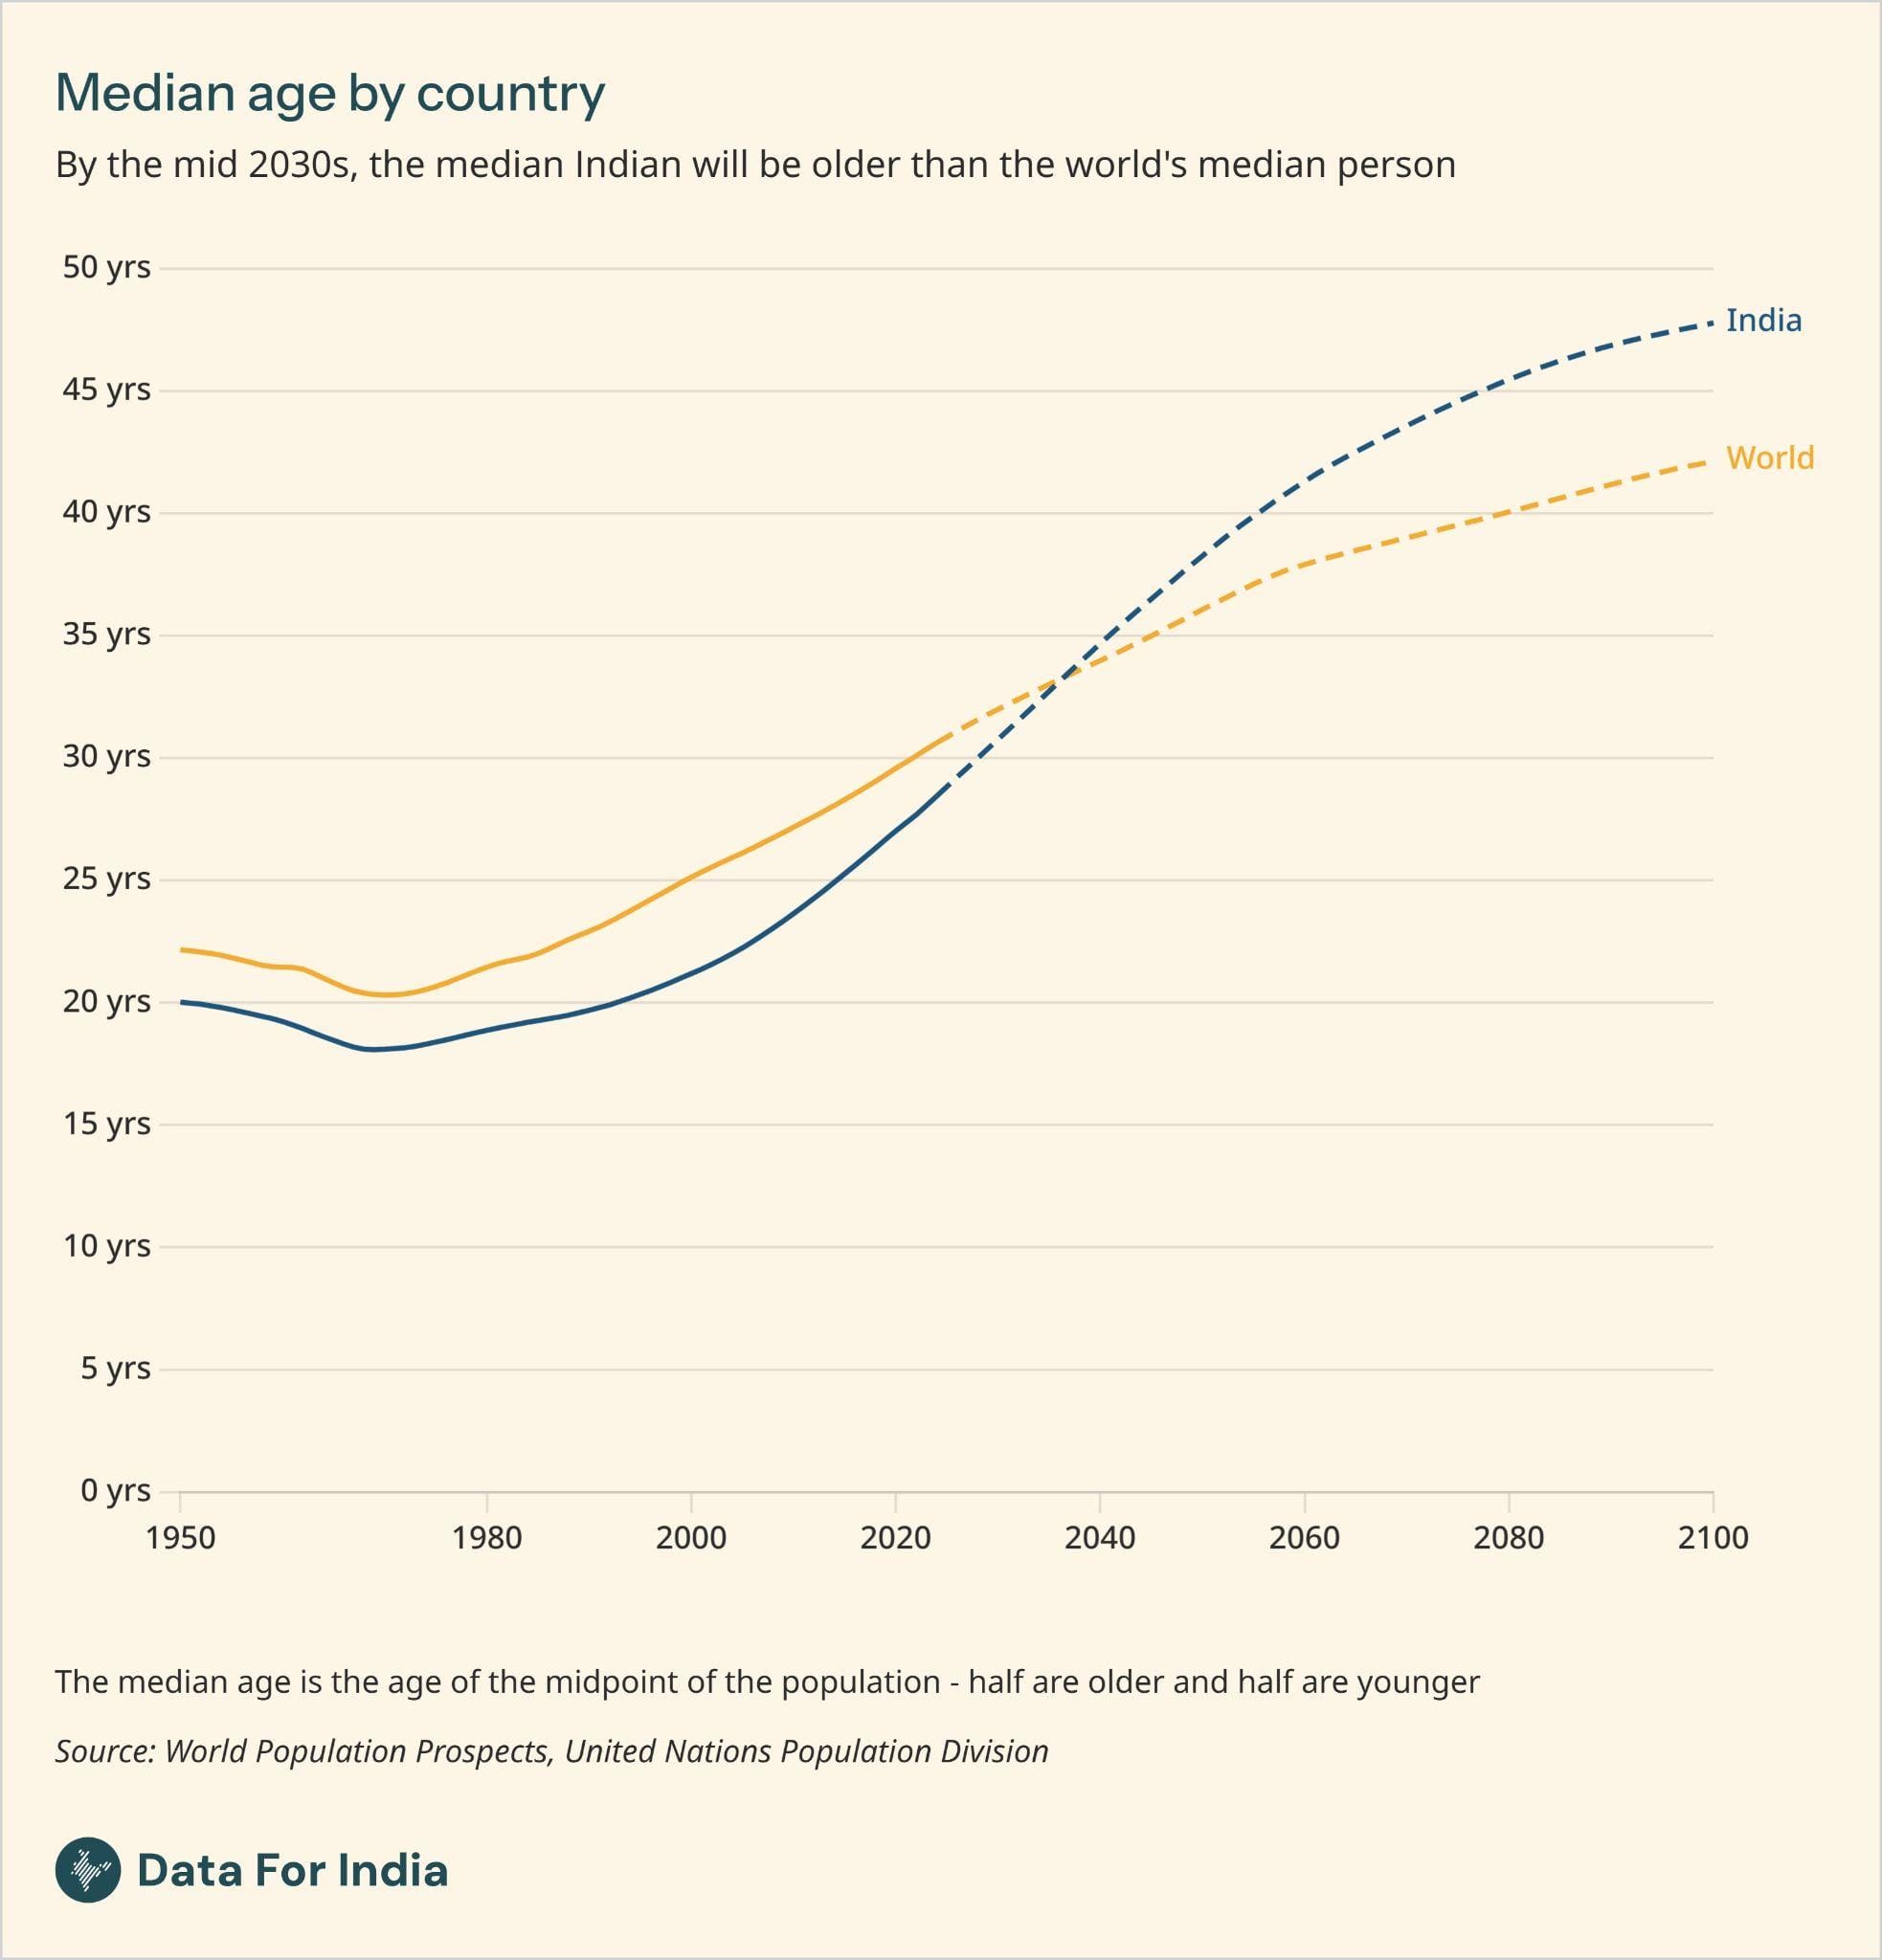
- The Economist interviewed Rukmini S., for their feature on India’s demographic shift, and reused our chart on mothers’ age at childbirth in India.
- Our World In Data cited the Periodic Labour Force Survey explainer by Pramit Bhattacharya and Nandlal Mishra in their deep dive on work and employment.
- Mint cited Rukmini S’ work in demography in their reporting on falling fertility rates, later childbearing, and what this could mean for India’s population outlook.
- Datawrapper featured Juhi Chatterjee’s work on regional temperature trends in their Data Vis Dispatch, highlighting the stark differences visible in our charts.
Talking Point
One chart worth sitting with this month, from a Data For India team member.
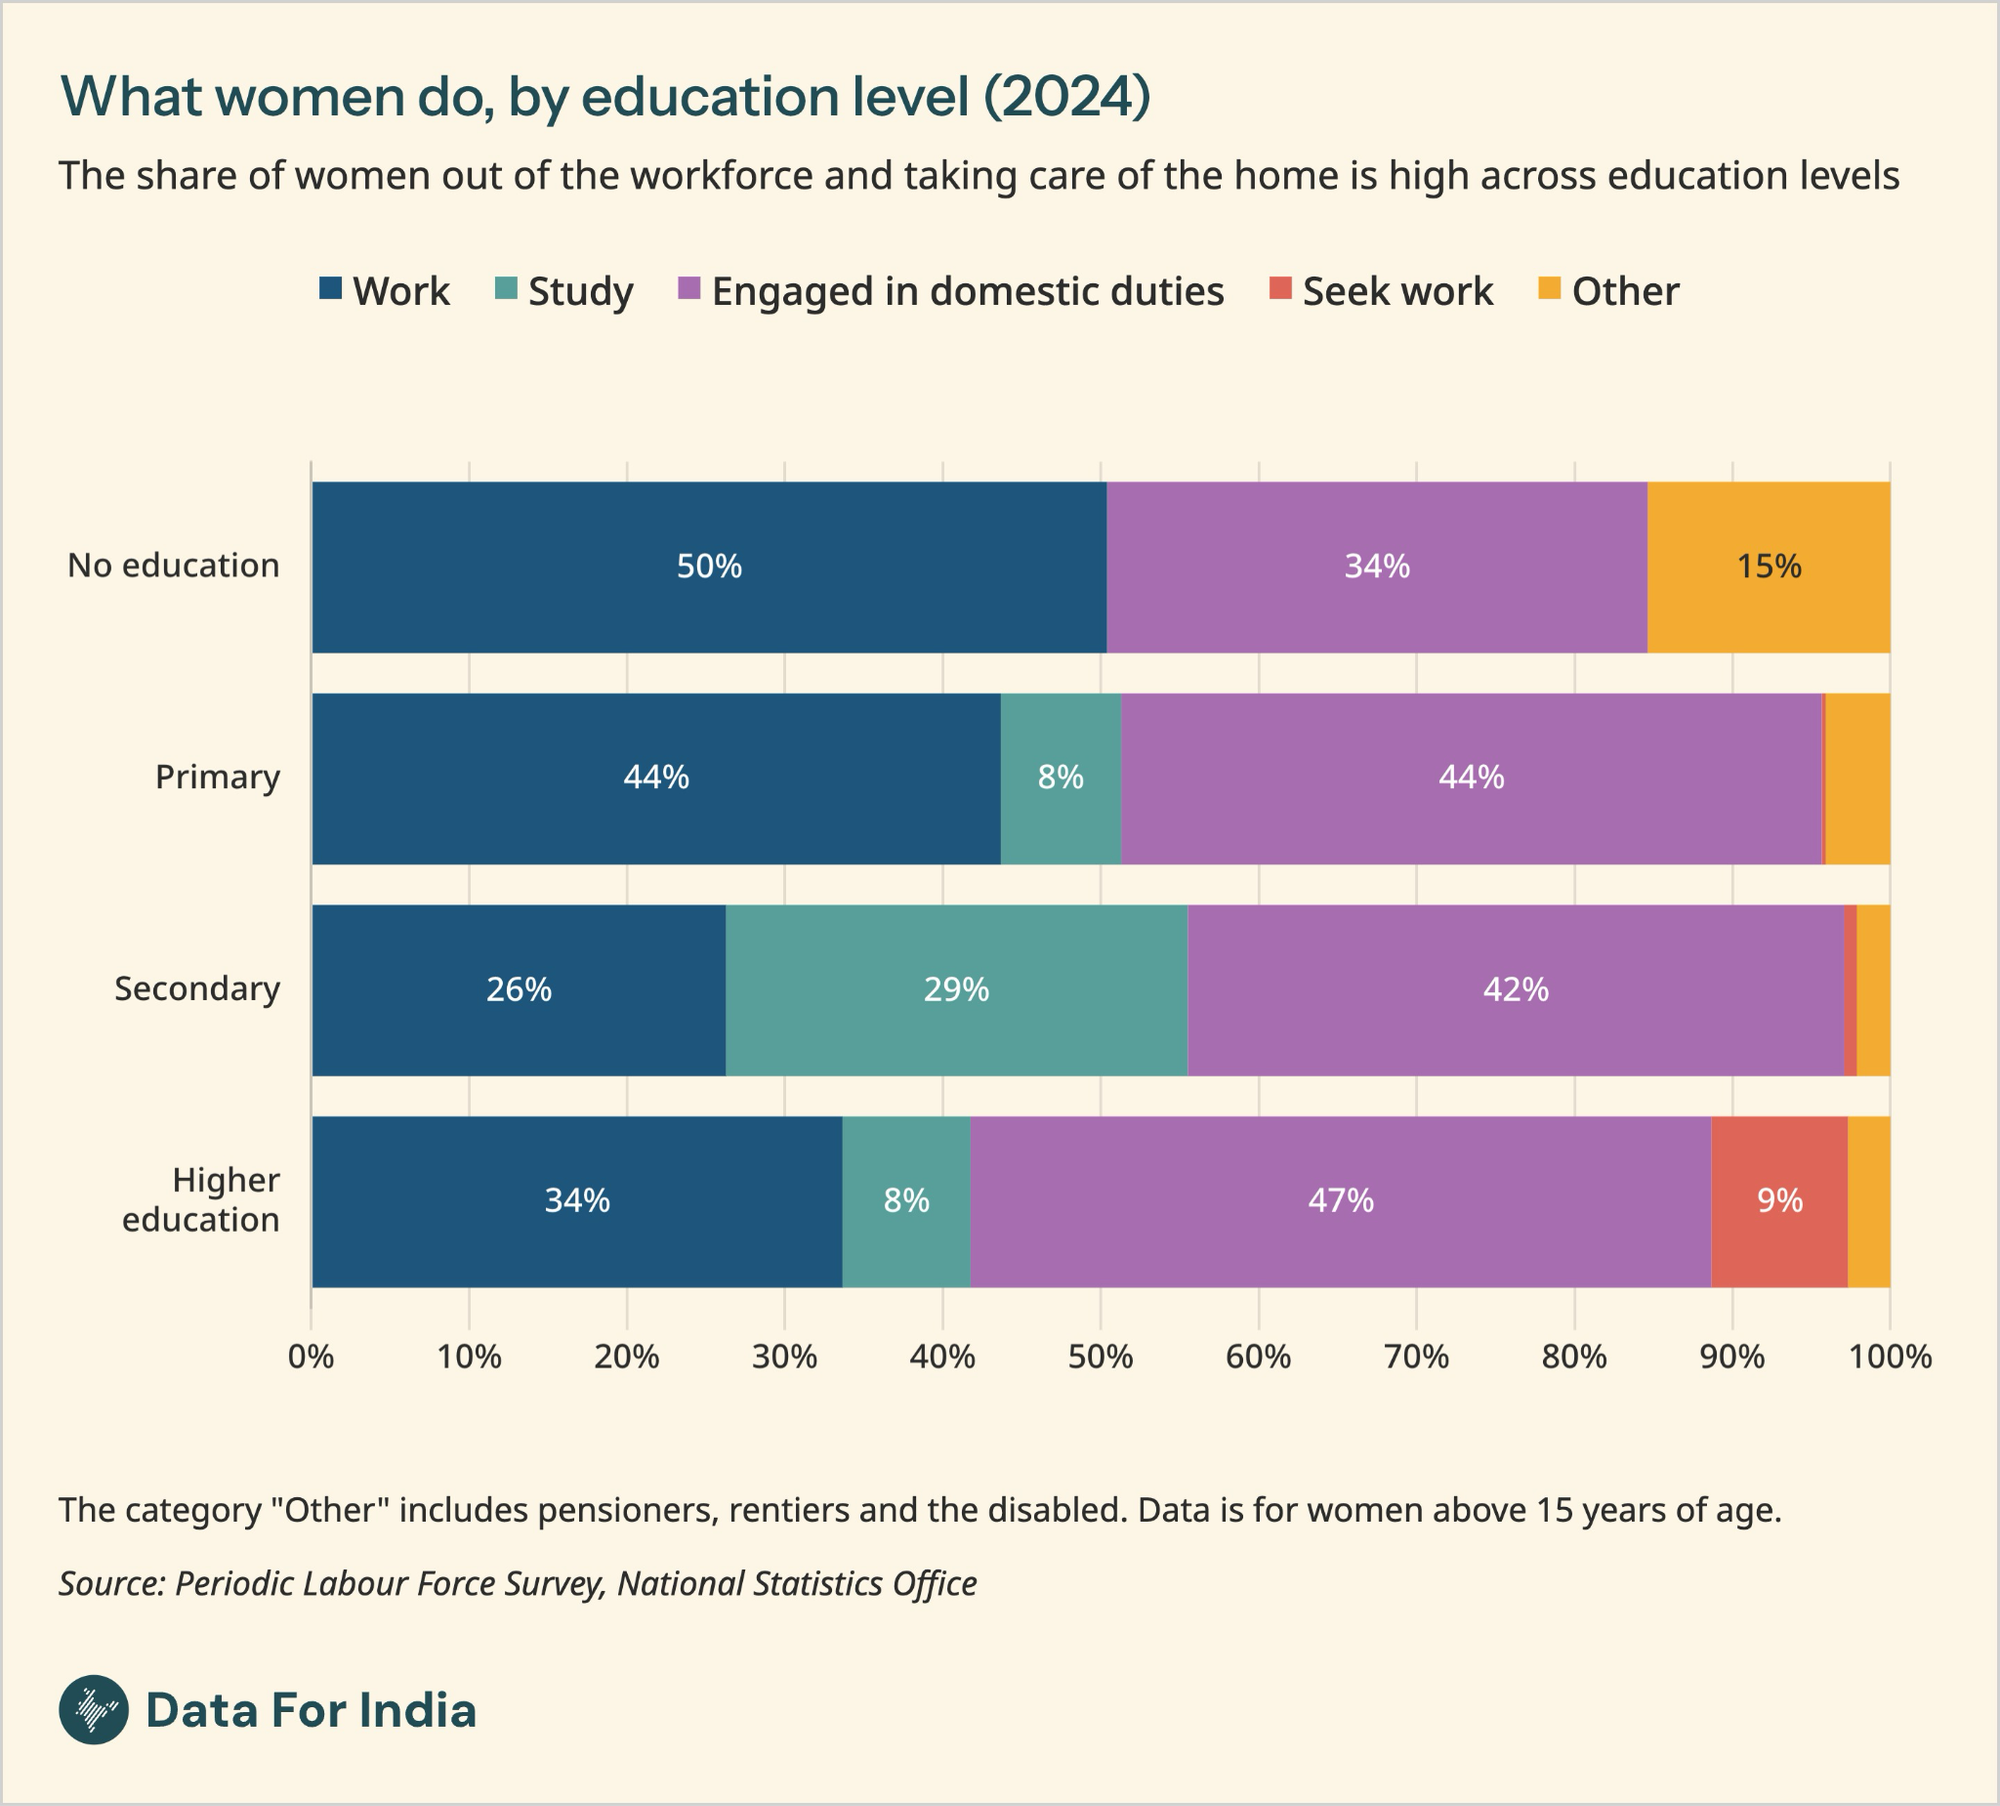
Women with higher education degrees are more likely to be out of the labour force than women with no education. It is also worth noting that women now outnumber men in post-graduate enrolments. I see many capable women around me who choose childcare and family responsibilities over paid work.
As we celebrate the growing number of educated women, it’s also important to think about what can be done to help them remain in the workforce.
— Pragnya, Engineering Lead
That’s it for the June 2026 edition of The Roundup. If something you read in this edition changed how you see India, write to us by replying to this email or reaching out at info@dataforindia.com.
We’ll be back on the last Friday of next month.