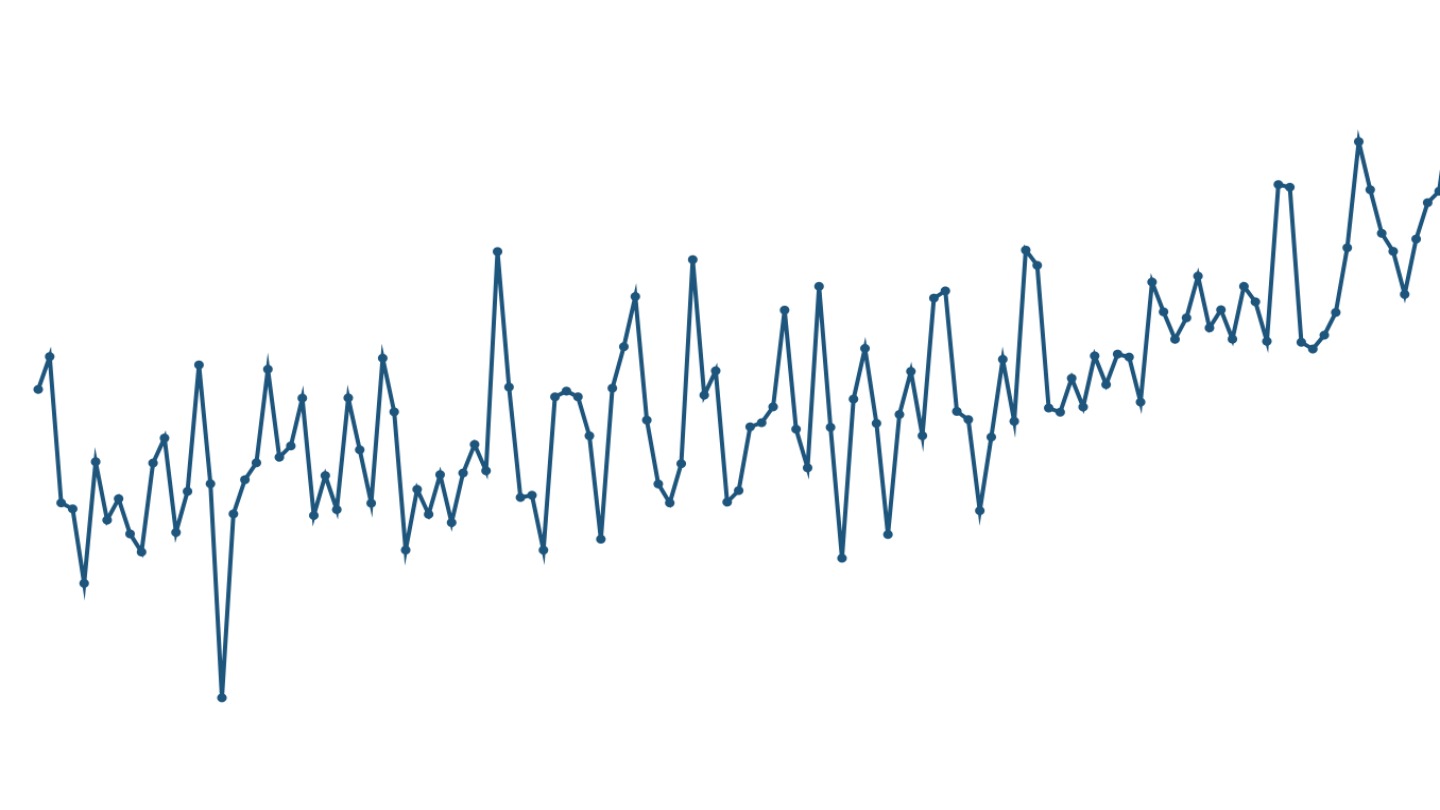
The total annual rainfall across India has remained broadly stable since the early twentieth century. Yet, there are distinct changes in the pattern of seasonal rainfall. Using more than 120 years of India Meteorological Department (IMD data), we look at the distinct trends emerging across pre‑monsoon, monsoon, post‑monsoon and winter, to understand not just how much it rains, but also how the patterns of rainfall are changing.
This seasonal lens reveals a more nuanced story than national averages alone can tell. By breaking down the data by season, we uncover trends such as the decline of winter rainfall and the intensification of pre‑monsoon extremes, which helps explain changing weather patterns and supports better planning for water and agriculture.
This analysis of long-term rainfall trends relies on observational records maintained by the India Meteorological Department. These datasets combine observations from thousands of rain gauges across India and extend back to 1901 making them among the longest rainfall records available for any tropical monsoon region.
To enable consistent seasonal analysis across India's diverse climate zones, the IMD has transformed station-based rainfall observations into spatially continuous gridded datasets. These datasets fill in the gaps between rainfall measurements from individual stations across a regular grid covering the entire country. IMD provides rainfall data at a 0.25° × 0.25° resolution allowing seasonal totals and anomalies to be analysed at relatively fine spatial scales. This gridded approach is particularly useful for seasonal studies, as it enables consistent comparison of rainfall patterns across regions and over time.[1]
Total seasonal rainfall
India's rainfall is governed by distinct seasonal systems, following the classification of the IMD. The south-west monsoon (June-September) dominates the country's hydro-climate, delivering approximately 75-80% of annual rainfall. This core monsoon period is driven by the seasonal reversal of winds and the formation of cyclonic systems in the Bay of Bengal. The north-east monsoon (October-December), also termed the post-monsoon season, provides a crucial secondary rainfall period, particularly for southern states. Additional precipitation arrives through winter rainfall (January-February), associated with western disturbances originating in the Mediterranean region[2] and pre-monsoon rainfall (March-May), which brings thunderstorms, lightning and hail.
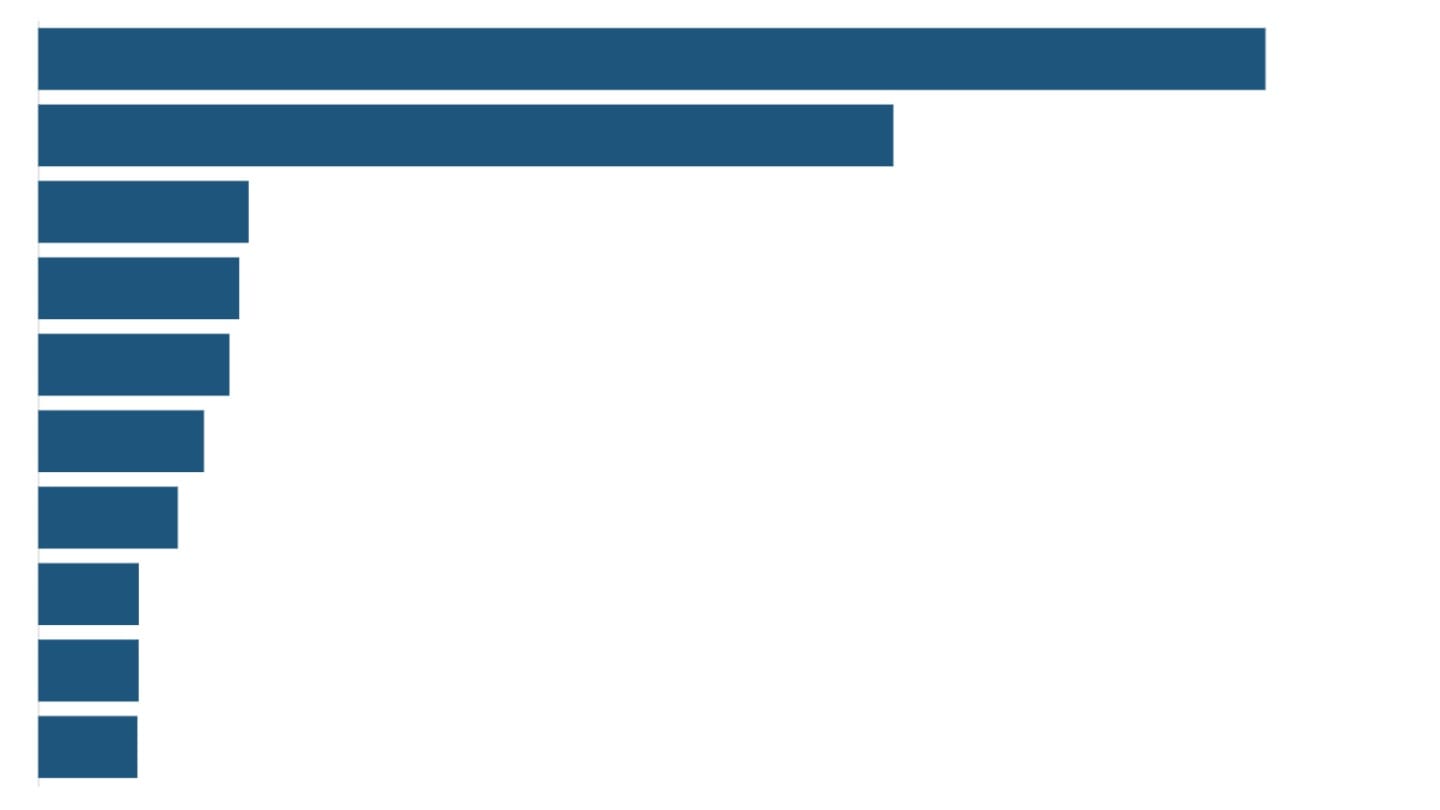
Over the last 120 years, the four seasons have seen changes in the rainfall they receive to varying degrees.
The pre-monsoon season is the only period exhibiting an increase, with annual rainfall rising by approximately 5.8% (between 1901-2024) suggesting a modest rise. This aligns with recent IMD observations of more frequent pre‑monsoon thunderstorms and heavier May rains, including the highest all India average monthly rainfall for May in 2025 since 1901.[3]
The monsoon season shows a moderate decline of 2.5% in total rainfall over the period of 1901-2024.[4] However, this decline is not statistically significant, meaning that it could be attributed to natural multi‑decadal variability since the monsoon has historically alternated between wet and dry epochs lasting 30‑40 years.[5]
The post-monsoon season shows a slight decline in total annual rainfall of −2.3% (over 1901-2024) indicating relatively minor changes compared to other seasons.
Winter shows the most pronounced decline in relative terms with rainfall decreasing by about 25% (over 1901-2024), indicating a substantial weakening. Notably, winter is also the only season where the trend is statistically significant, suggesting that this decline is robust and not driven just by variability.
Variations in seasonal rainfall
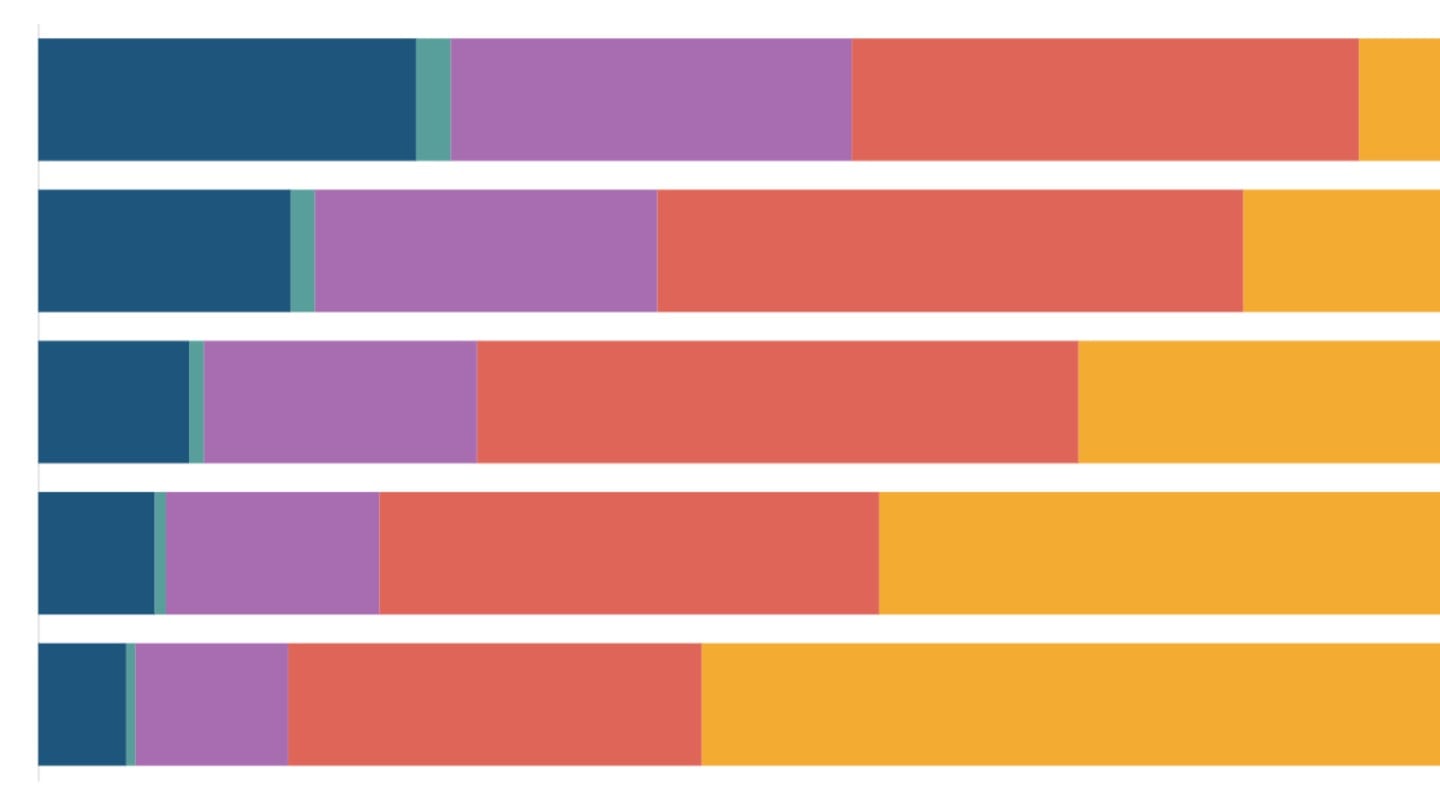
In addition to average rainfall and long-term trends, it is important to understand how variable rainfall is from year to year. One of the most commonly used measures of variability is the Coefficient of Variation (CV).[6] This measure of variation tells us how much the rainfall changes from year to year. A low value means the rainfall is consistent, while a high value means it is unpredictable with some years being wet, while others are dry.
At the all-India level, clear differences emerge across seasons. The south-west monsoon has the lowest variation (9.8%), signifying that despite occasional droughts and floods, the total monsoon rainfall at all‑India level is steady. In contrast, the post-monsoon season or the north-east monsoon is far more variable with a variation of 27%, making it significantly less predictable. This difference is particularly important for southern India where a substantial share of annual rainfall occurs during October-December. Unlike the relatively reliable south-west monsoon, the higher variability of post-monsoon rainfall leads to more frequent swings between floods and dry spells.
Winter has the highest variation (34%) meaning that winter rainfall is erratic reflecting the unpredictable behaviour of western disturbances.[7] The pre-monsoon season shows moderate variation (17%).
Seasonal rainfall anomalies
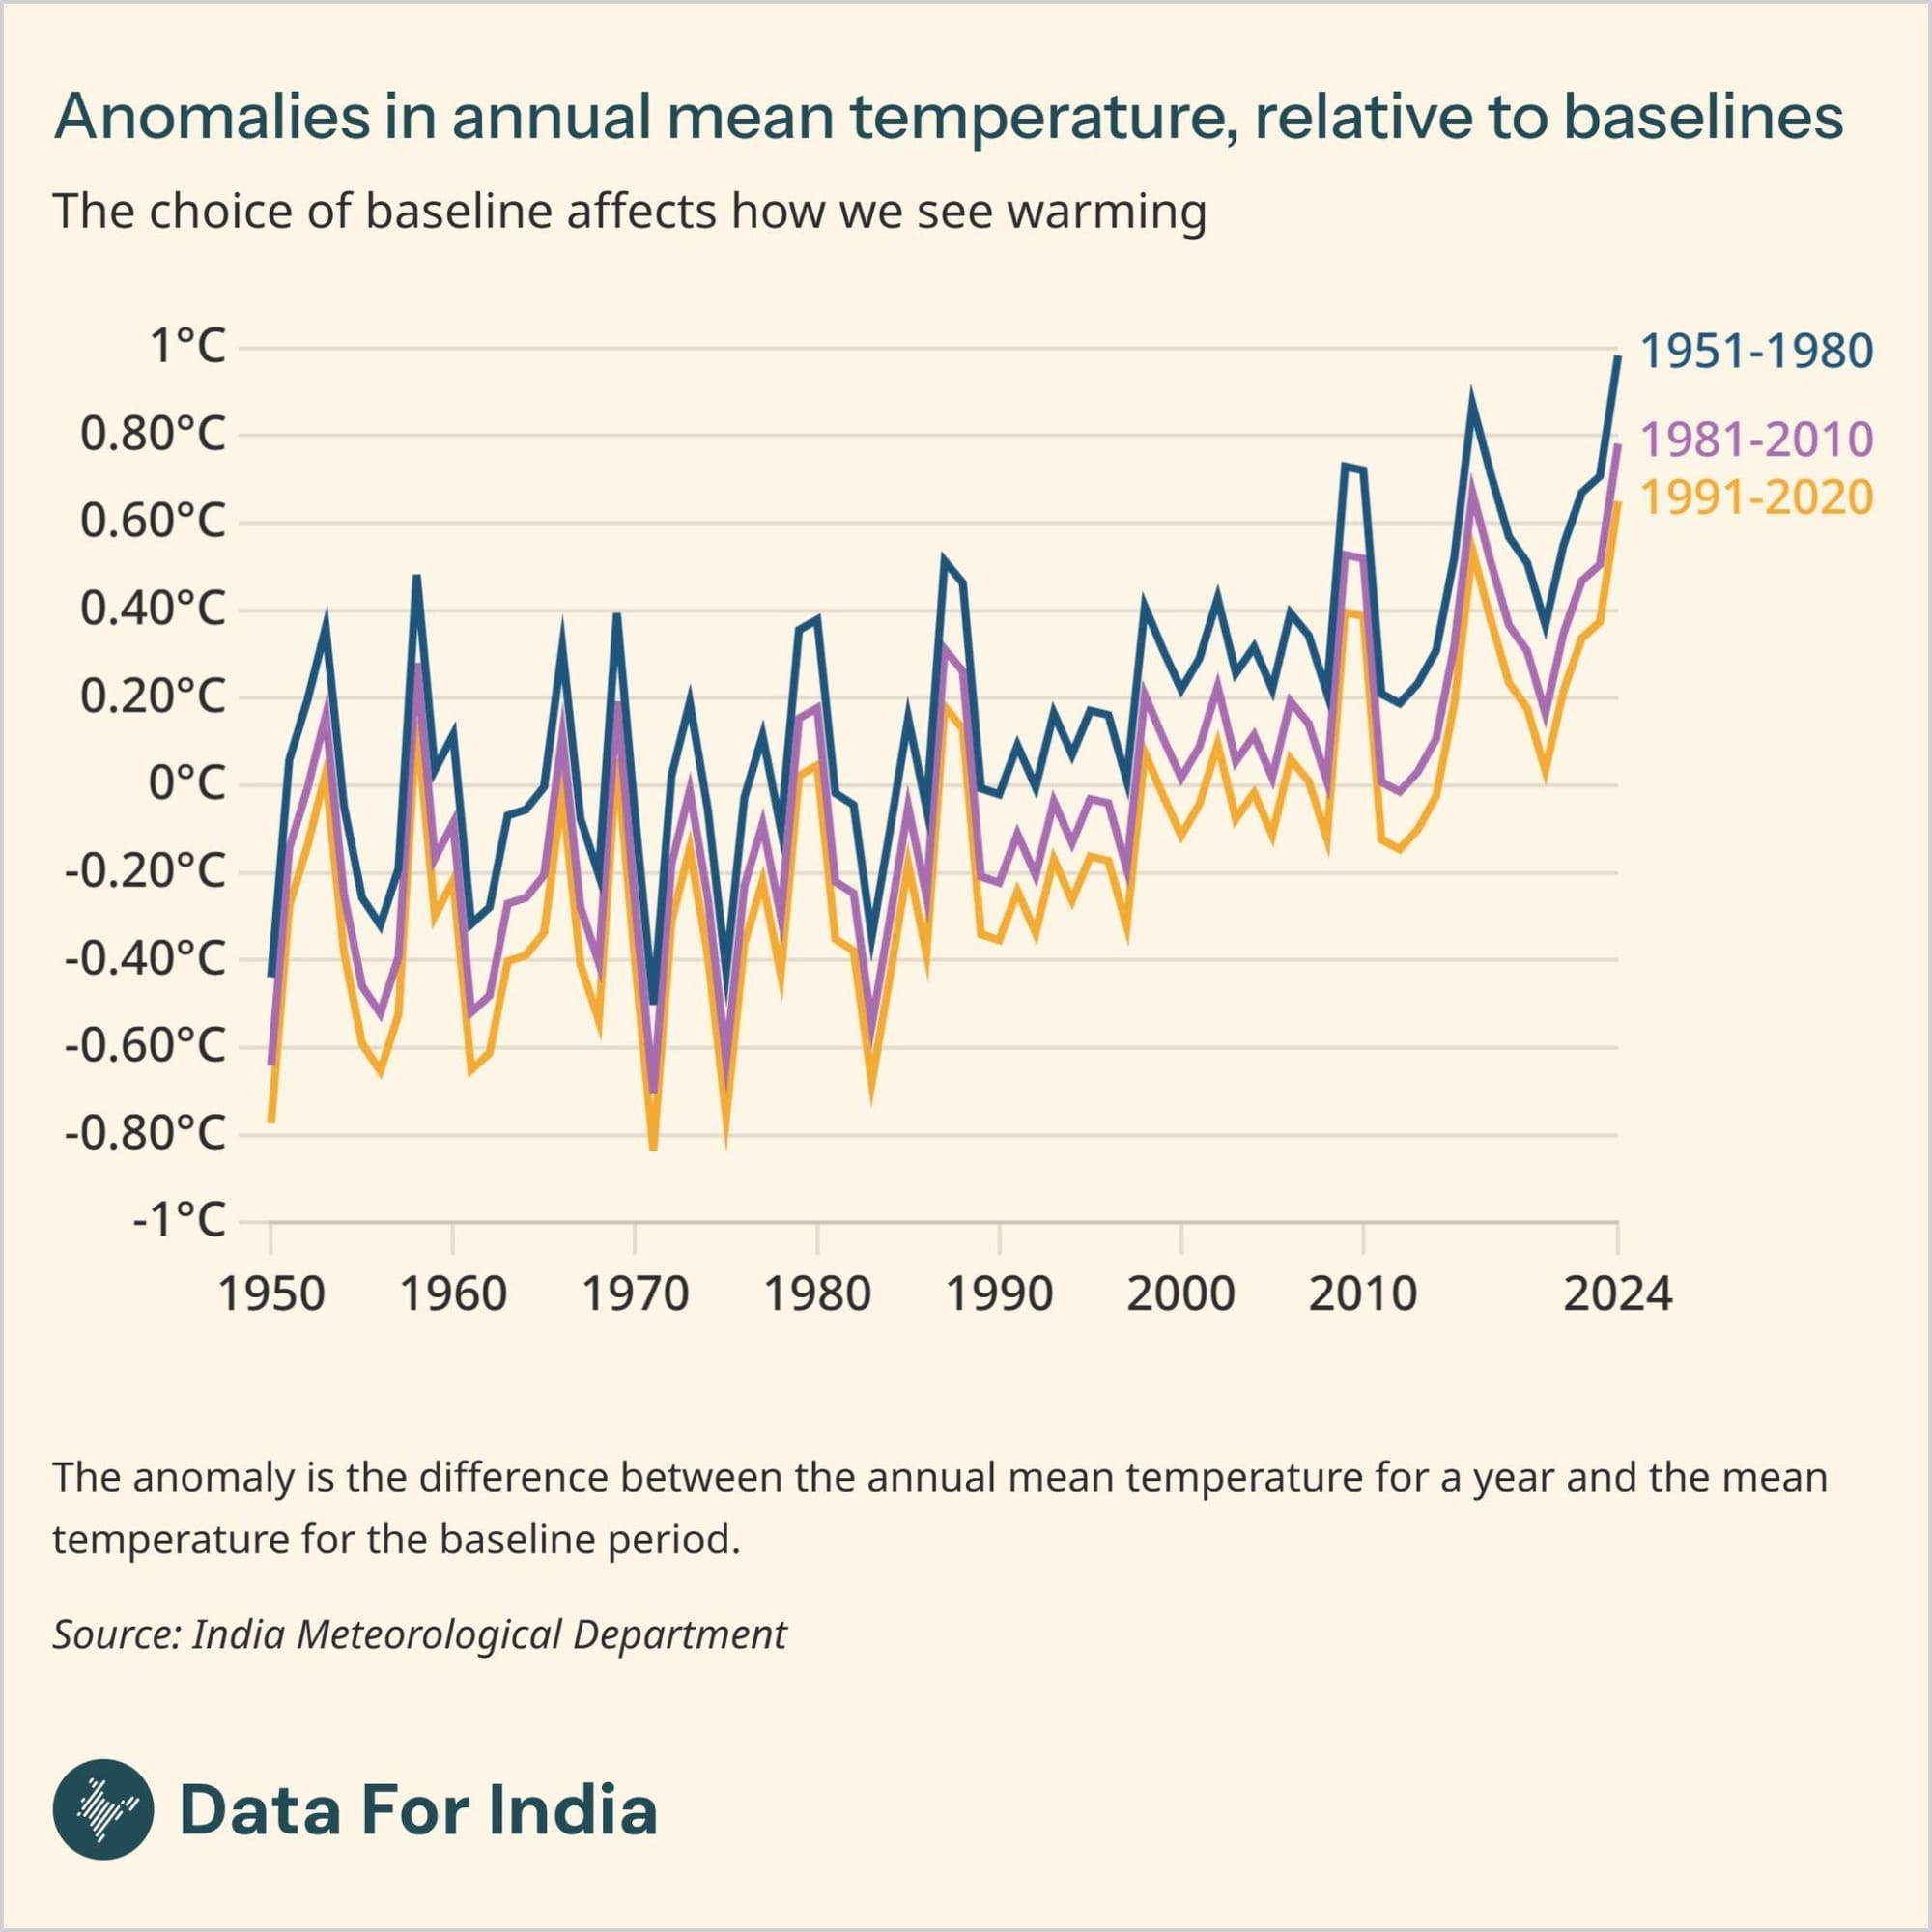
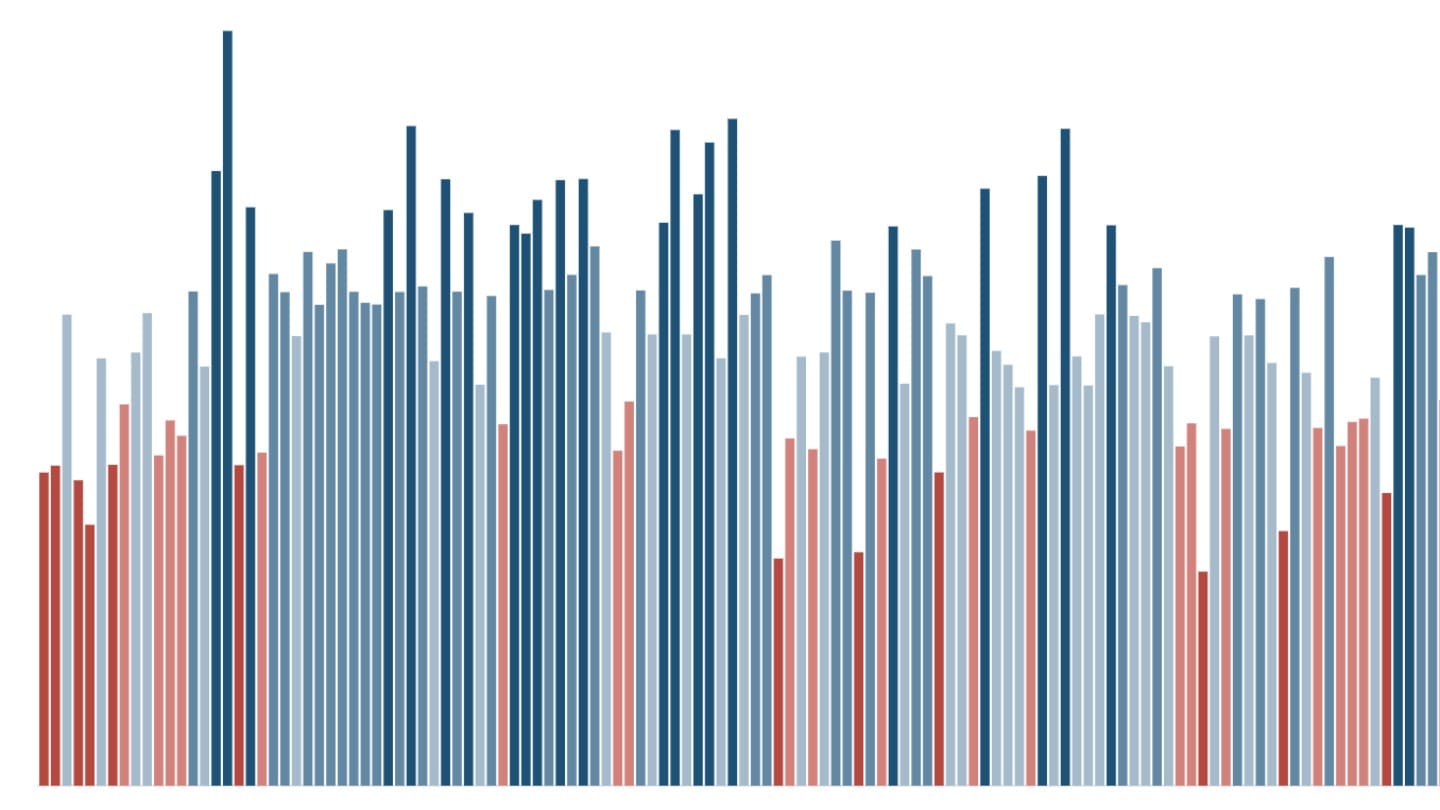
Rather than relying on absolute totals alone, rainfall is often expressed in terms of anomalies to understand how a given year or season compares to 'normal' conditions.A rainfall anomaly is defined as the deviation of observed rainfall from a long-term average. Anomalies can be measured in millimetres or, more commonly, as a percentage deviation from the average. This approach has two key advantages: it instantly tells you if a season was wetter or drier than 'normal', and it allows you to compare seasons, even if their average rainfall is very different.
The benchmark used for such comparisons is the Long Period Average (LPA), the average rainfall over a defined region calculated over a long-term base period, typically spanning 30-50 years.[8] Using such an extended period smoothens out short-term fluctuations in individual years caused by climate phenomena such as El Niño[9] and La Niña[10], providing a stable reference against which individual years can be evaluated.
The official rainfall normals used in India are calculated by the IMD, which currently uses the 1971-2020 period as its climatological baseline. Based on this dataset, the LPA for India's south-west monsoon is 868.6 mm. Rainfall within ±10% of the LPA-that is, between 90% and 110% of the average-is considered normal. Rainfall below this range is classified as below-normal or deficient, while rainfall above this threshold is categorised as above-normal or excess. Similar LPAs are also estimated for the other seasons (winter, pre-monsoon and post-monsoon) allowing for consistent seasonal comparisons across the annual cycle. These concepts provide the foundation for analysing seasonal rainfall anomalies, enabling a clearer understanding of variability within and across seasons.
Pre-monsoon rainfall displays large year-to-year swings but only a minor increase. Monsoon rainfall, which dominates the annual total, shows only a slight weakening. The averages of the first half of the 20th century (1901-1959) were modestly above normal (around +3.9%), while in the recent decades (2015-2025) this surplus has narrowed to about +0.6%.
Post-monsoon rainfall stands out for its variability and a shift in long-term behaviour. While overall trends for the post-monsoon are minor, the seasonal average has declined from about +4.3% in early decades to near-normal levels in recent years indicating a loss of surplus rainfall. Since the 1960s, the season has seen more frequent deficits and fewer extreme surplus years.
Winter is the only season that shows a pronounced, statistically significant decline. In the early 20th century, winter rainfall was on average 16.6% above the LPA, while in recent decades it has shifted to 3.2% below the LPA. Extreme years range from +92.7% (2005) to -71% (1902), highlighting the high volatility of winter alongside its directional decline.
Overall, the analysis of seasonal rainfall anomalies over the long term highlights winter and post-monsoon as the most volatile seasons, both exhibiting significant departures from the long-term mean. In contrast, monsoon and annual rainfall patterns have remained relatively stable, despite subtle tendencies towards decline.
Seasonal changes in daily rainfall patterns
Daily rainfall indicators, computed separately for the four meteorological seasons, provide a more granular lens through which to examine how India's rainfall regime is evolving. While annual and seasonal totals offer a useful overview, they often mask important shifts in how rainfall is distributed within seasons.
A season classified as 'normal' in terms of total rainfall may still experience severe floods if rainfall is concentrated in a few intense events, or agricultural stress if long dry spells interrupt crop growth cycles. It is these intra-seasonal patterns assessing how rainfall is spaced across days that shape outcomes for agriculture, water availability and extremes.
To capture these dynamics, daily rainfall metrics are used instead of just seasonal totals to describe the temporal distribution of rainfall within each season. These metrics are constructed using standardised thresholds developed by the Expert Team on Climate Change Detection and Indices[11], which provide a consistent framework for measuring and comparing climate variability and change by providing international coordination and standardised tools for climate analysis[12].
Daily rainfall metrics can be broadly classified into two categories - those that measure frequency of rainfall, and those that measure intensity of rainfall.
Frequency of seasonal rainfall
Frequency metrics include rainy days (days with ≥2.5 mm), consecutive wet days (longest rain spell) and consecutive dry days (longest dry spell).
The pre-monsoon season (March-May) exhibits the most significant and consistent changes across multiple metrics. The number of annual rainy days has increased, rising from an average of 10-15 days in the early twentieth century to 15-26 days in recent decades with a peak of 31 days recorded in 1990.
Intensity of seasonal rainfall
Intensity metrics included in this analysis are maximum daily rainfall (highest rainfall recorded on a single day), maximum five‑day rainfall (highest five‑day total rainfall), and the total precipitation on wet days (defined as the sum of rainfall received on all rainy days within the season).
When analysing daily rainfall at the seasonal level using national‑scale gridded data, the reported values often appear modest because they represent an average depth across the entire country, not the intensity at any specific location. In a large and climatically diverse country like India, rainfall on any given day, even within a single season is highly localised. Some regions receive heavy downpours, while many others remain dry. Consequently, smaller daily values at the national level occur because rainfall is averaged across regions with differing patterns ranging from heavy rain in some places to little or no rain elsewhere.
Pre-monsoon rainfall indicators show sharp increases in both the amount and intensity of rain. Recent years, particularly 2015-2025, have seen increased pre-monsoon activity, with 2025 recording the highest values for both daily and five-day pre-monsoon rainfall. Total seasonal rainfall has also risen sharply from roughly 20-50 mm in earlier decades to over 100 mm in recent years, reaching 126 mm in 2025, the second-highest pre-monsoon seasonal total.
Together, these trends indicate a structural shift in the pre-monsoon season toward more frequent and more intense rainfall reinforcing evidence of increasing variability and extremity in rainfall patterns in India.
The south-west monsoon season (June-September), which accounts for the bulk of India's annual rainfall shows relative stability in total precipitation and the number of rainy days over the long term. However, there is evidence of increasing intensity in shorter-duration rainfall events. In particular, maximum five-day rainfall has increased, indicating that rainfall is becoming more concentrated within multi-day wet spells. Year-to-year variability remains high, with occasional extreme multi-day rainfall events, such as the 2019 peak in five-day rainfall, standing out against an otherwise stable background.
Rainfall during the post-monsoon (October-December) and winter (January-February) seasons is typically low and episodic, often driven by western disturbances in winter and cyclonic systems in the post-monsoon season. Winter and post-monsoon seasons show no significant long-term trends, with variability remaining the dominant feature.
Breaking down daily rainfall indicators by season reveals that not all periods of the year are changing in the same way. The data indicates that pre-monsoon rainfall is undergoing the most pronounced change, becoming wetter, more frequent and more intense. In contrast, total monsoon rainfall remains broadly stable, though multi-day events are intensifying.
[1] In a gridded rainfall dataset at a spatial resolution of 0.25°, the country is divided into grid cells of roughly 25 × 25 km. Each grid cell represents an area-averaged estimate derived from multiple nearby rain gauge stations rather than a single-point observation. These datasets are constructed from a dense observational network, with quality control procedures applied to remove erroneous values and ensure temporal consistency before generating the gridded surface.
[2] The western disturbance is an extra-tropical storm originating over the Mediterranean that brings winter rain and snow to northern India and is critical for rabi crops. Due to climate change, the frequency and intensity of strong western disturbances have declined while their activity has shifted toward the pre‑monsoon months, contributing to a drying trend in the winter rainfall.
[3]Press Release on Climate Summary for the month of May 2025 (2025), India Meteorological Department, Ministry of Earth Sciences.
[4] Total change in seasonal rainfall over 1901-2024 is calculated by using the trend slope (mm/year) to obtain percentage change relative to the long‑term seasonal mean (1901-2024). Percentage change is then obtained by dividing this total change by the long‑term seasonal mean and multiplying by 100. This method expresses the net linear shift relative to the long term mean allowing for comparison across seasons.
[5] An 'epoch' refers to a multi-decadal phase typically spanning around 30-40 years during which the monsoon exhibits a tendency toward relatively wetter or drier conditions compared to the LPA. These epochs do not imply uniform conditions, rather they are characterised by substantial year-to-year variability with individual dry or wet years occurring within an overall wetter or drier phase.
[6] The Coefficient of Variation expresses the extent of variation relative to the average rainfall and is calculated as the ratio of the standard deviation to the mean, typically expressed as a percentage.
[7] The western disturbance is an extra-tropical storm originating over the Mediterranean that brings winter rain and snow to northern India and is critical for rabi crops. Due to climate change, the frequency and intensity of strong western disturbances have declined while their activity has shifted toward the pre‑monsoon months, contributing to a drying trend in the winter rainfall.
[8] The benchmark for what constitutes a '"normal'" year has been periodically reduced as the climate changes. The LPA for the southwest monsoon was changed from about 890 mm (1951-2000) to 880 mm (1961-2010) and is currently 868.6 mm (1971-2020),
[9] El Niño and La Niña are opposite phases of the El Niño-Southern Oscillation (ENSO), a climate pattern in the tropical Pacific Ocean. El Niño (warmer ocean conditions) is generally associated with weaker monsoons and below-normal rainfall in India, while La Niña (cooler conditions) tends to strengthen monsoon rainfall. ENSO is a major driver of year-to-year variability in Indian rainfall, though its effects can vary depending on regional and ocean-atmosphere conditions.
[10] Parliament Question: Impact of La Niña on Climate Patterns (2025), Ministry of Earth Sciences, Press Information Bureau.
[11] The Expert Team on Climate Change Detection and Indices (ETCCDI) is a joint international initiative sponsored by the World Meteorological Organization (WMO) and other partner bodies. It has defined a core set of 27 standardised indices for temperature and precipitation extremes, including metrics such as consecutive dry days and maximum five-day rainfall, that have become the global standard for monitoring changes in climate extremes and are widely used in IPCC assessments.
[12] Indices and Data (n.d.), Expert Team on Climate Change Detection and Indices (ETCCDI), World Climate Research Programme / CLIVAR.