India is warming, but not all states are heating up equally. Differences in geography, elevation, land-use patterns, urbanisation and regional climatic conditions shape how warming is experienced locally, leading to considerable variation in both average temperatures and extremes across states.[1]
India's northern and Himalayan regions generally record lower mean temperatures (~15-20°C) as they are higher in both latitude and elevation, while southern and peninsular India are consistently warmer (around 26-29°C). Much of central and eastern India falls within an intermediate temperature band (roughly 23-28°C).[2]
Variations in warming patterns influence heat-related mortality, agricultural stress, electricity demand, and water availability differently across regions, underscoring the importance of localised climate adaptation planning.[3] Understanding these spatial patterns is therefore critical for designing targeted and effective responses.
Temperature variations and anomalies
Temperatures are commonly examined using three indicators - minimum, maximum and mean temperatures, each reflecting different dimensions of climate variability and change.[4] Minimum temperatures capture night-time conditions while maximum temperatures reflect daytime heat intensity; mean temperatures provide a measure of overall conditions.[5]
To examine this further, temperature anomalies, defined as deviations from a historical baseline, provide a clearer picture of how warming has evolved over time and across regions. Absolute temperatures vary widely due to differences in latitude, elevation and proximity to the coast. Temperature anomalies address this by comparing each location to its own long-term average, effectively normalising for geographic differences. This makes it possible to identify and compare underlying warming trends consistently across regions, seasons, and time periods even where absolute temperatures differ sharply.[6]
Meaningful temperature anomalies depend on a clearly defined and standardised baseline. The IMD follows World Meteorological Organization (WMO) guidelines in defining a climatological normal as the average of a climate variable over a continuous 30-year period. These baselines are updated every decade to ensure that "normal" conditions reflect the most recent climate context and provide relevant reference points for climate monitoring and operational decision-making.[7] The 1991-2020 baseline period represents the current official baseline used in IMD climate reporting and reflects the most recent 30-year average climate conditions in India.[8]
These anomalies have been presented in the form of maps[9] comparing decadal[10] mean temperature anomalies across India for two different periods - 1970-1980 and 2015-2025, relative to the 1991-2020 climatological baseline. Similar maps have also been provided for minimum and maximum temperature, enabling comparison of how daytime and night-time warming patterns vary spatially across states and regions. Negative anomalies (shown in blue) indicate temperatures cooler than the baseline average, while positive anomalies (shown in red) indicate warmer-than-baseline conditions.[11]
Variations in mean temperature anomalies
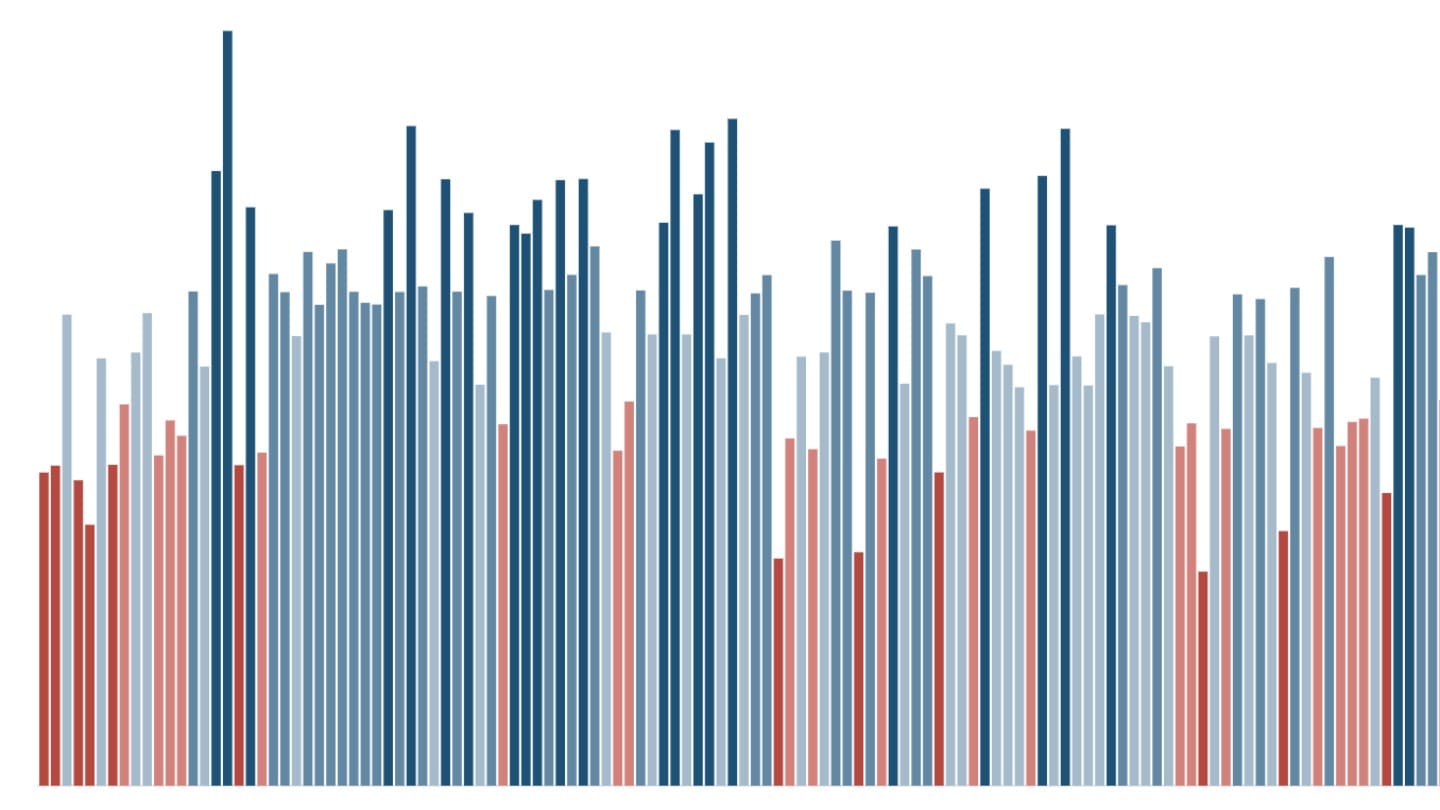
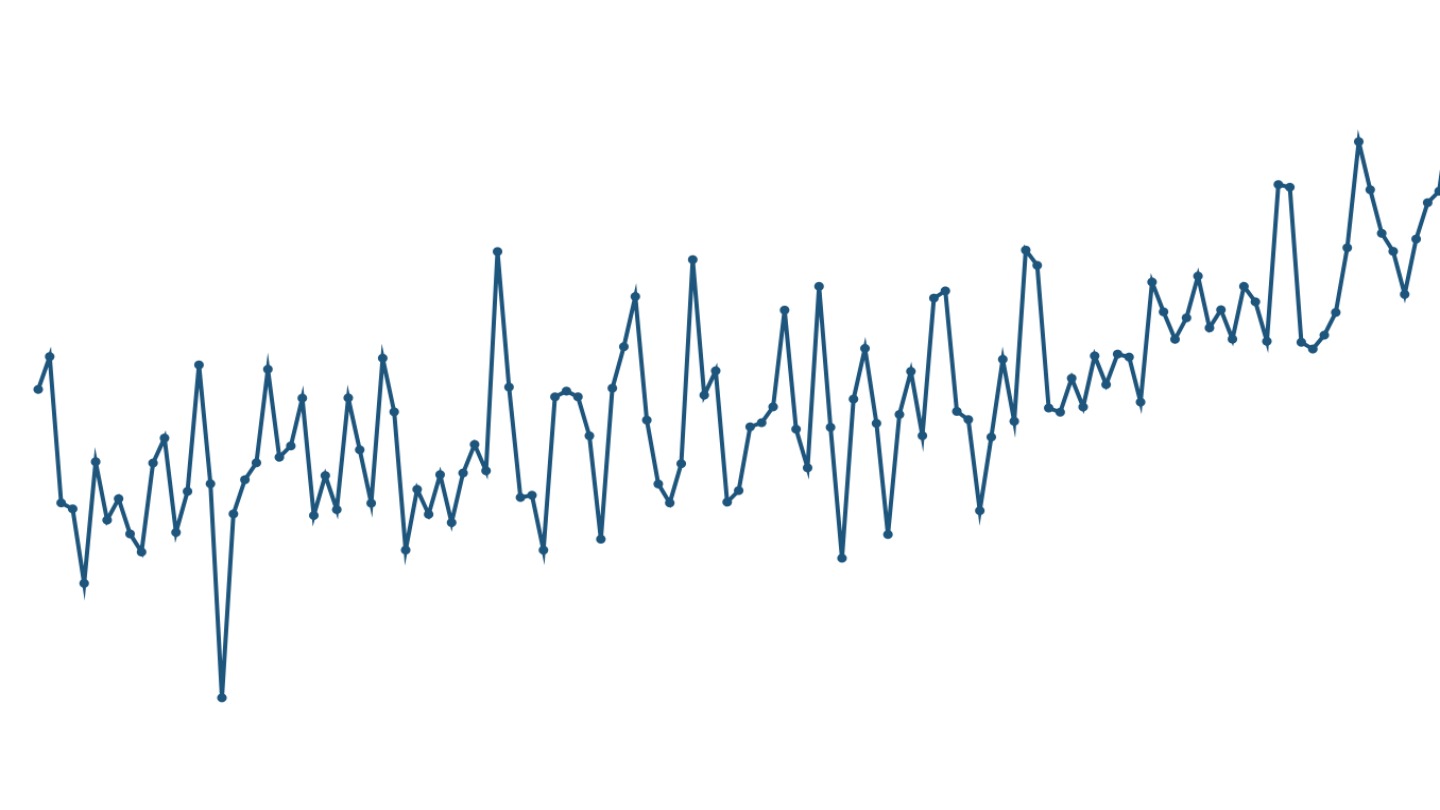
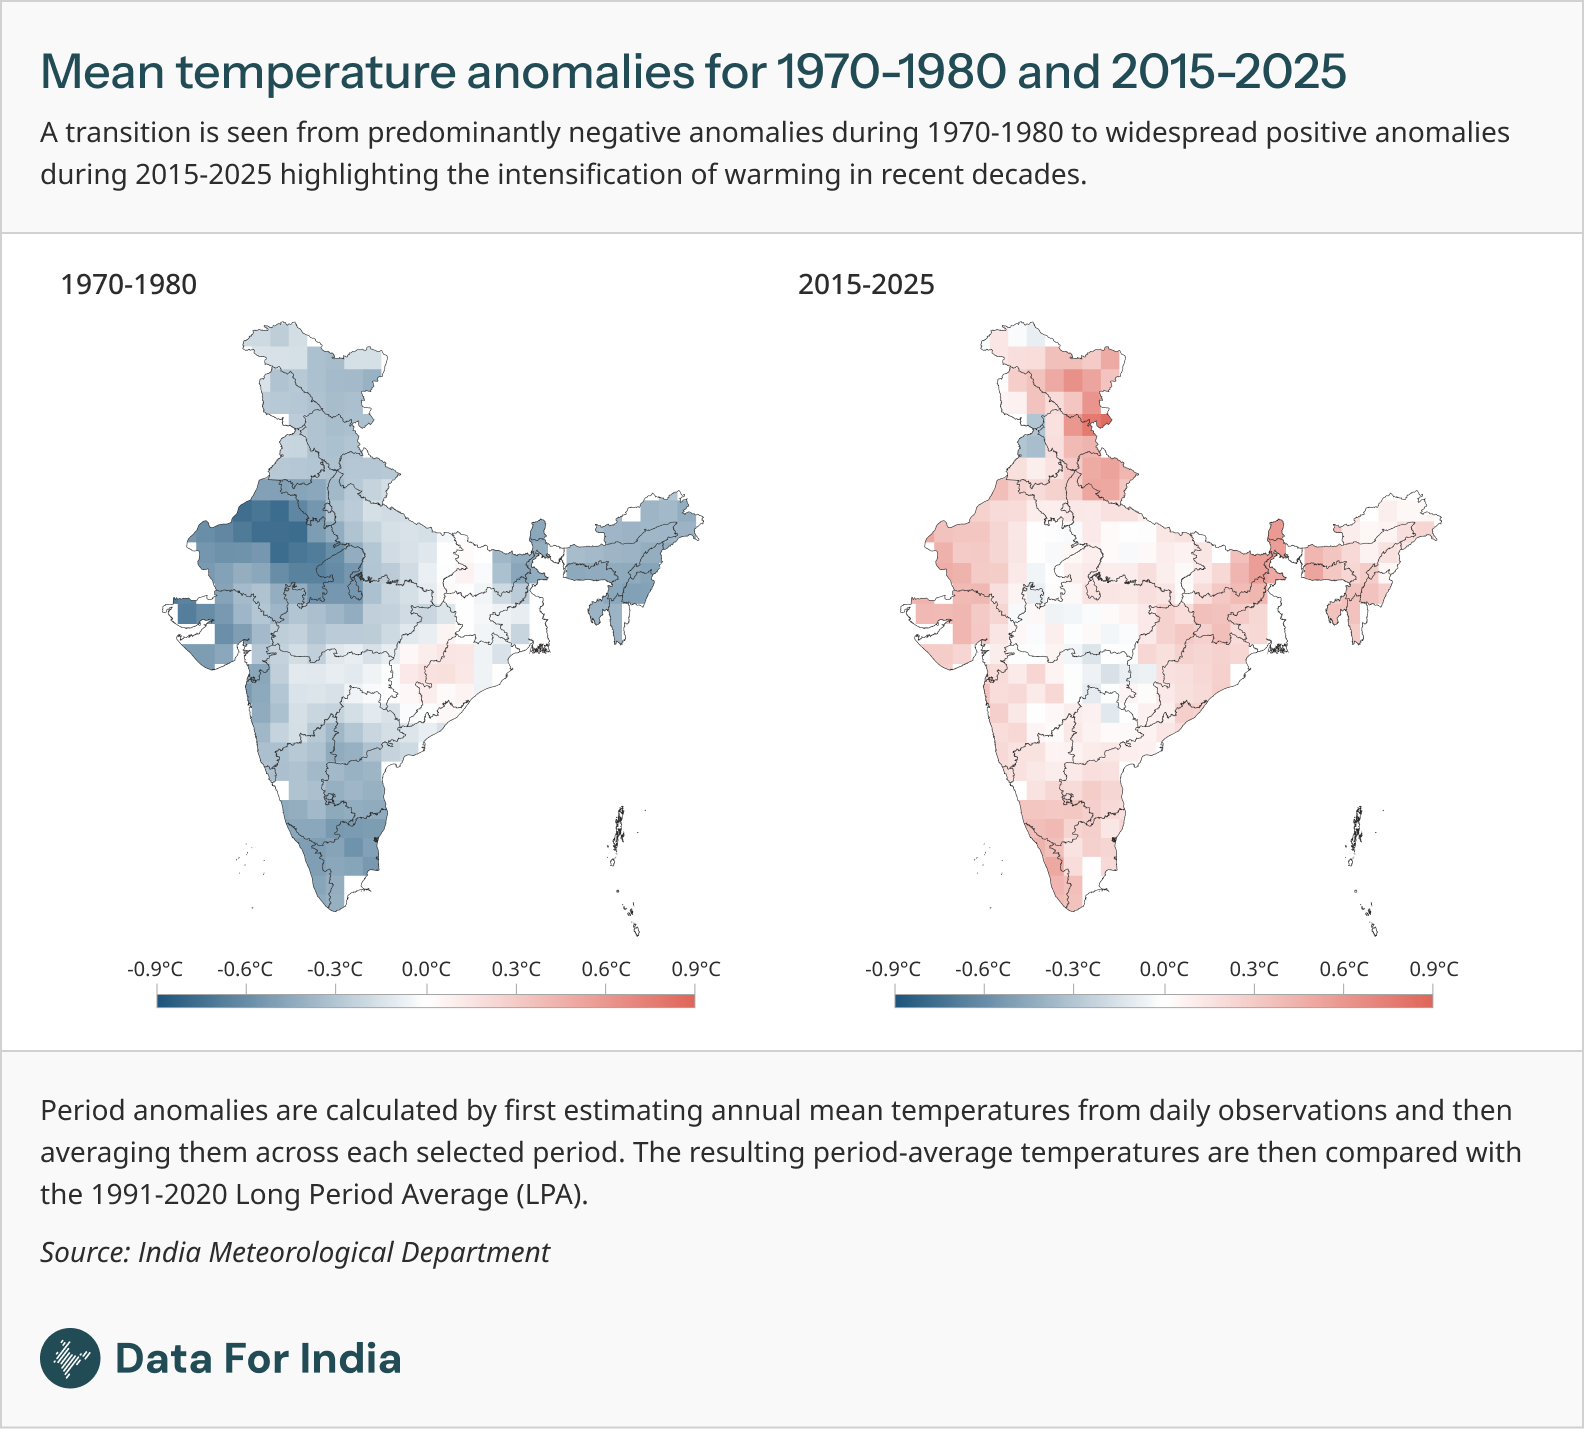
Mean temperature anomalies across Indian states reveal a clear and sustained shift in warming beginning in the late 20th century. During the 1970s and 1980s, most states recorded negative anomalies relative to the 1991-2020 baseline, with average anomalies around -0.3°C. The highest negative anomalies were concentrated across western and northwestern India, particularly in Rajasthan and Gujarat, where temperatures were around 0.6°C to 0.8°C cooler than the 1991-2020 baseline. Much of peninsular India and the Himalayan region also recorded temperatures below the baseline in the range of -0.4°C to -0.6°C during this period.
Conversely, the period between 2015 and 2025 is dominated by widespread positive anomalies (averaging around +0.32°C nationally), with temperatures across most states consistently exceeding the baseline. Strong warming is particularly visible across northern, western and parts of eastern India, while a few localised regions continue to show relatively weaker anomalies. Rajasthan, Gujarat and northwest India show positive anomalies ranging between 0.2°C to 0.4°C and are among the faster-warming zones.
The strongest warming is concentrated across northern and northeastern India where parts of states such as Jammu and Kashmir, Himachal Pradesh, Uttarakhand, Assam and Arunachal Pradesh record mean temperature anomalies ranging from +0.5°C to +0.8°C above the 1991-2020 baseline. This suggests that warming is not occurring uniformly across the country, with mountainous and ecologically sensitive regions experiencing particularly pronounced temperature increases.[12] Thus, northern and north-eastern states demonstrate mean temperature decadal anomalies that are higher than national mean decadal anomalies of +0.32°C for the past decade.
Maximum temperature anomalies across states
Examining trends in maximum temperature at the state level helps identify where daytime warming is accelerating most rapidly and whether historically heat-prone regions are becoming even more vulnerable to extreme heat conditions. The analysis shows that maximum temperatures have increased across nearly all states, although the rate and intensity of warming vary.
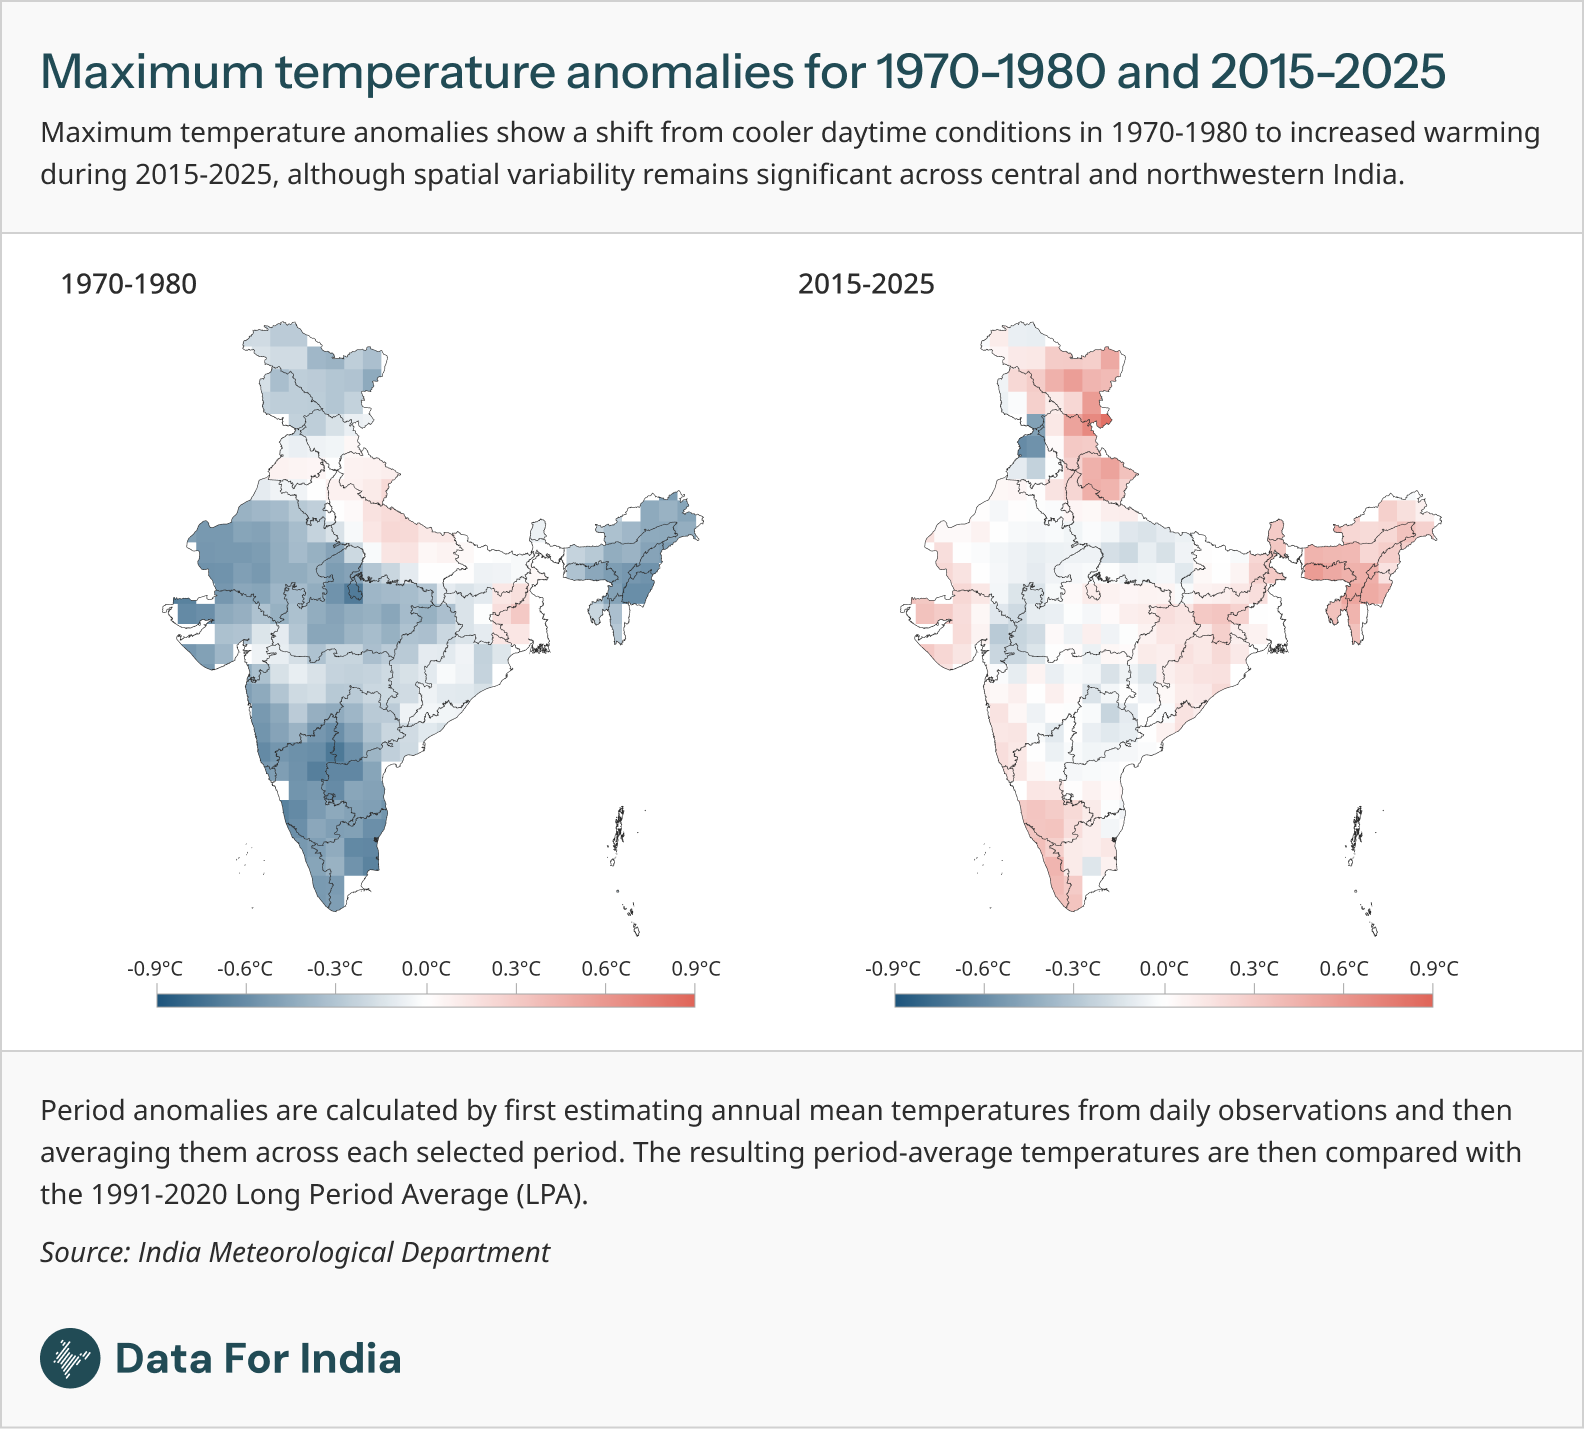
The maximum temperature anomaly maps reveal a strong shift in India's daytime heat patterns between the late 20th century and recent decades. During 1970-1980, much of the country experienced negative maximum temperature anomalies relative to the 1991-2020 baseline, with anomalies ranging from approximately -0.8°C to +0.3°C and a national anomaly close to -0.3°C. Major parts of western, southern and northeastern India recorded substantially cooler daytime temperatures during this period, particularly across Rajasthan, Gujarat, Maharashtra, Karnataka, Tamil Nadu, and the northeast, where anomalies ranged between -0.4°C and -0.7°C below the baseline. Central India including parts of Madhya Pradesh, Chhattisgarh, Maharashtra, and adjoining regions recorded negative maximum temperature anomalies in the range of -0.4°C to -0.6°C, indicating temperatures cooler than the baseline.
By 2015-2025, the pattern shifted markedly towards positive maximum temperature anomalies, indicating that daytime temperatures across most states are now consistently warmer than the historical baseline. Recent decadal anomalies for states range from approximately -0.6°C to +0.8°C, with a national maximum anomaly of around +0.1°C. The highest positive anomalies are once again concentrated across northern and northeastern India, where parts of Jammu and Kashmir, Himachal Pradesh, Uttarakhand, Assam, Arunachal Pradesh and adjoining Himalayan regions record daytime warming approaching +0.5°C to +0.8°C above the baseline.
At the same time, spatial variability is evident. Across southern India, the southern parts of Karnataka and Kerala show higher maximum anomalies ranging between +0.4°C to +0.6°C above the baseline while the other peninsular regions show relatively moderate anomalies. Some parts of central Uttar Pradesh and central India especially in Madhya Pradesh and Chhattisgarh show negative or near-zero maximum temperature anomalies (ranging from -0.2°C to 0.0°C) indicating greater heterogeneity in daytime warming across the region. Parts of northeastern India seem to be emerging as new zones of increasing daytime heat exposure. Together, these patterns point to an intensification of daytime warming across India, with important implications for heatwaves, agriculture, labour productivity, electricity demand and public health.
Rising minimum temperatures: warmer nights
A key feature of recent temperature change across India is that minimum temperatures, representing night-time conditions, are rising steadily, often at a faster rate than maximum temperatures.
During 1970-1980, minimum temperature anomalies ranged from approximately -1.2°C to +0.5°C, with a national anomaly close to -0.4°C relative to the 1991-2020 baseline. The highest negative anomalies were concentrated across northwestern India, particularly in Rajasthan and Gujarat and parts of Sikkim and the Himalayan region where night-time temperatures were often 0.7°C to 1.2°C cooler than the modern baseline. Weak positive anomalies were seen across parts of eastern and central India, including sections of Odisha, Chhattisgarh and Jharkhand where minimum temperature anomalies locally approached +0.2°C to +0.5°C. However, such positive anomalies remained spatially limited during the 1970s and 1980s.
By 2015-2025, the pattern shifts decisively towards universal night-time warming. Minimum temperature anomalies range from approximately -0.2°C to +0.9°C, with the mean minimum anomaly across all states being +0.3°C. The highest positive minimum anomalies are concentrated across the eastern and north-eastern states of West Bengal and Sikkim and parts of Rajasthan and Jammu and Kashmir where anomalies range between +0.5°C and +0.9°C above the baseline.
The persistence of positive anomalies across nearly all states indicates that night-time warming is becoming an increasingly dominant feature of India's climate system. This reduction in night-time cooling increases cumulative heat stress, especially during prolonged warm periods and heatwaves.[13]
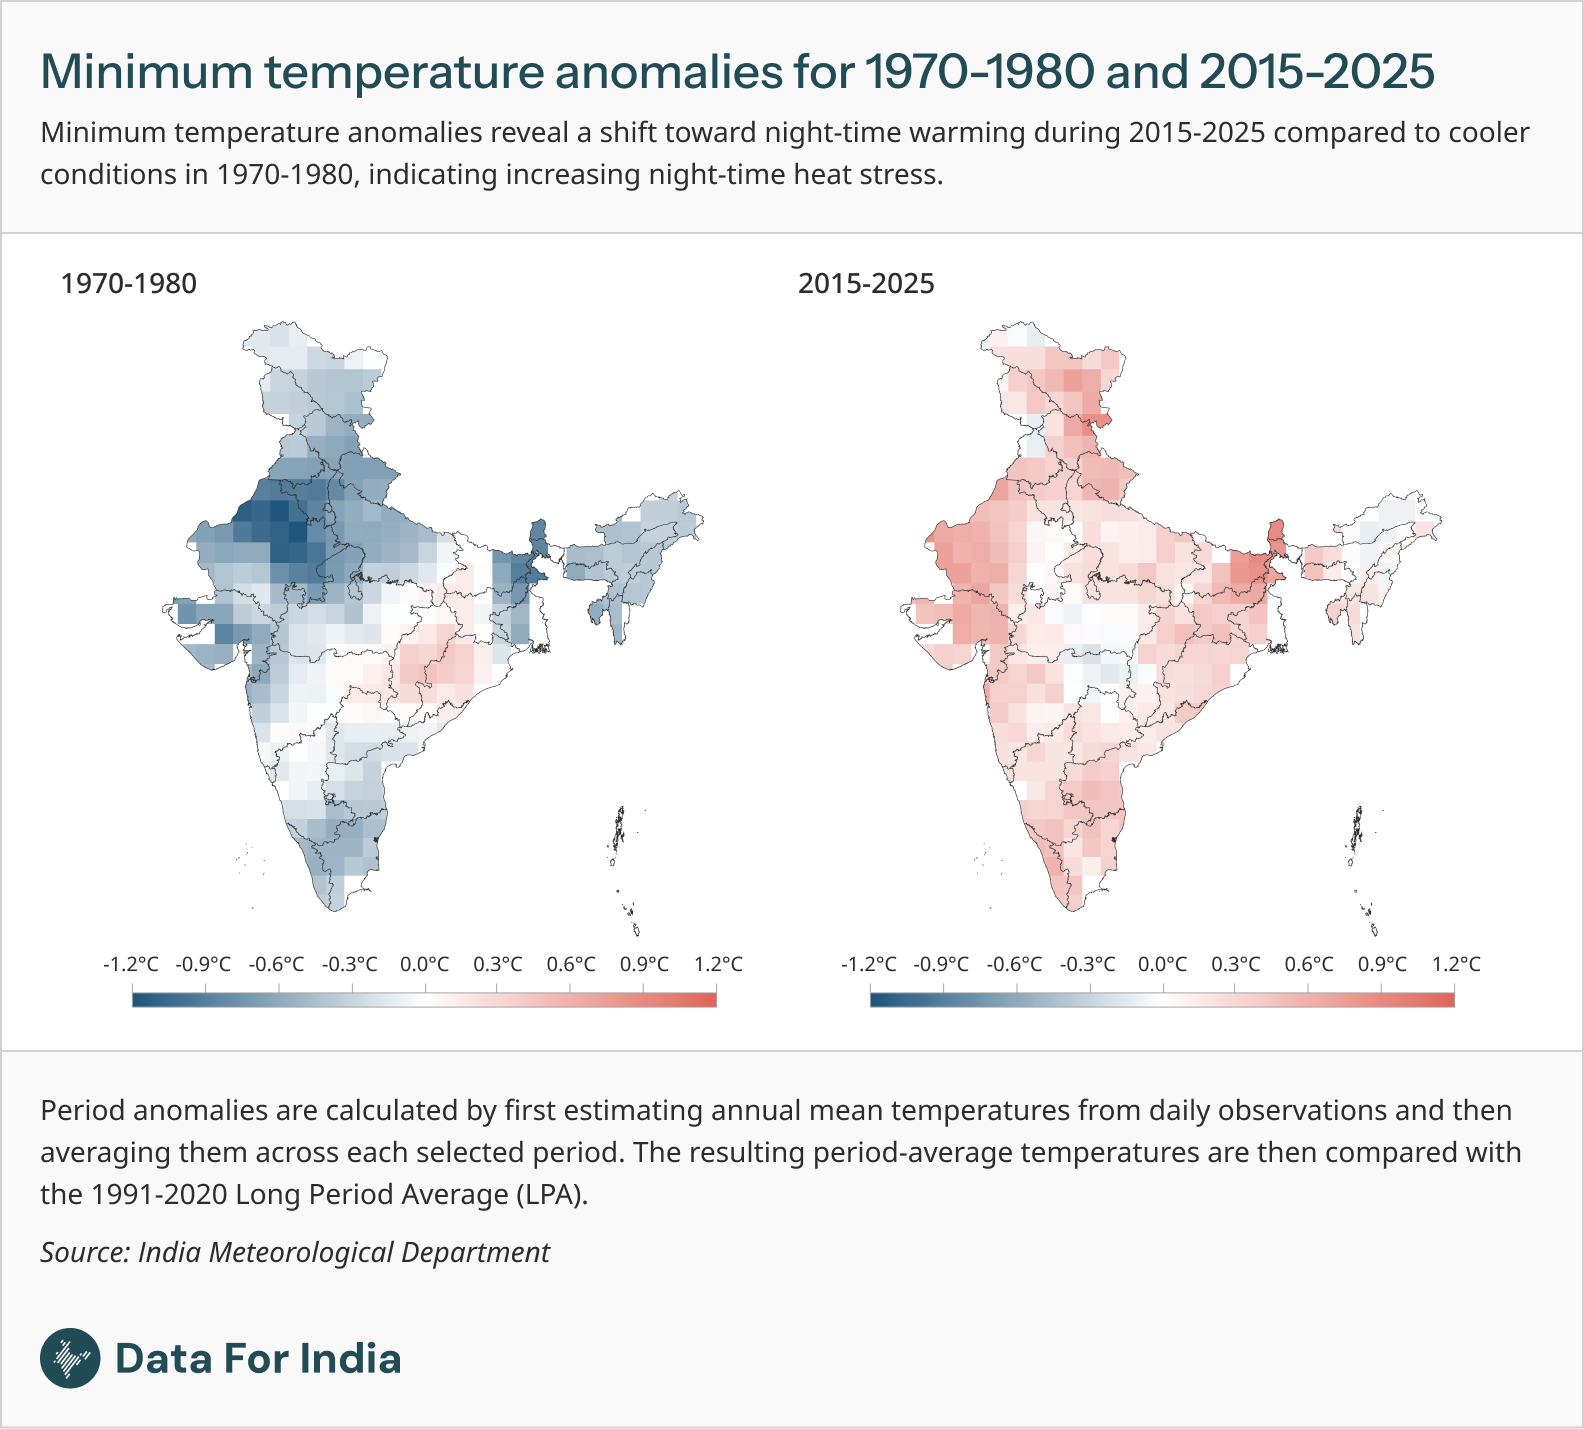
Minimum temperature anomalies for 2015-2025 show higher and more widespread warming across India compared to maximum temperature anomalies. Annual minimum temperature anomalies for the period range from about -0.2°C to +0.9°C, with a mean minimum anomaly of around +0.3°C, while maximum temperature anomalies range from approximately -0.6°C to +0.8°C with a lower mean maximum anomaly of about +0.1°C.
There are also pronounced regional differences in warming patterns. Northern and northwestern states continue to exhibit strong increases in maximum temperature anomalies, contributing to more intense daytime heat exposure and extremes. The northern region, including Himachal Pradesh, Uttarakhand and Ladakh, shows some of the highest positive minimum temperature anomalies in the country. Meanwhile, northeastern states like Arunachal Pradesh, Assam, Manipur and Mizoram have transitioned from being significantly cooler than the baseline in the 1970s in terms of both mean and maximum temperature anomalies, to consistently warmer in the last decade, indicating a shift in regional climate patterns. Night-time temperatures are also warming more consistently across regions, whereas maximum temperatures show greater spatial variability, including pockets of near-zero or negative anomalies in parts of central and northwestern India.
These varying state-level patterns demonstrate that warming is geographically differentiated. Some regions are experiencing stronger increases in daytime extremes, while others show more pronounced night-time warming, highlighting the need for region-specific planning and adaptation strategies.
[1] Summary for Policymakers in Climate Change 2021: The Physical Science Basis (2021), Masson-Delmotte et. al, Intergovernmental Panel on Climate Change (IPCC).
[2] Exploring Heat and Cold Wave Susceptible Areas of India Using Consistency and Frequency Coupled Novel Approach (2022), Rajesh Sarda et al., Natural Hazards / Springer.
[3] Climate Change 2022: Impacts, Adaptation and Vulnerability - Chapter 10: Asia (2022), IPCC, Intergovernmental Panel on Climate Change / Cambridge University Press.
[4] India's surface air temperature data is sourced from the India Meteorological Department's (IMD) national observation network comprising over 500 manual observatories and more than 1000 Automatic Weather Stations (AWS). While advancements in instrumentation and an expanding network of monitoring stations have significantly enhanced data accuracy, long-term climate analyses rely on quality-controlled subsets of several hundred stations with continuous records. For long‑term climate analysis, the IMD uses a homogenised subset of approximately 700 stations with continuous records. Each station records daily maximum and minimum temperatures, contributing roughly 1,460 data points per station annually. This translates to over 500,000 station‑level observations per year that form the basis of the gridded dataset.
[5] Development of a high resolution daily gridded temperature data set (1969-2005) for the Indian region, (2009). Srivastava et. al, Indian Meteorological Department.
[6] WMO Guidelines on the Calculation of Climate Normals (WMO-No. 1203), (2017). World Meteorological Organization (WMO).
[7] The choice of baseline affects the magnitude of anomalies or the difference from the long-term average. So, a warmer baseline may yield smaller recent anomalies, while an older, cooler baseline produces larger positive anomalies for the same years.
[8] Historically, different 30-year periods have been used as baselines for analysing temperature change including the periods of 1951-1980 and 1981-2010. Following a global update led by WMO and national meteorological services, the 1991-2020 period has now been adopted as the most recent global climatological normal and is the current standard for operational reporting by many countries including India.
[9] These maps were generated using gridded annual temperature anomaly data from the India Meteorological Department (IMD). The IMD divides India's land surface into a grid of 1° x 1° cells (approximately 111km by 111km), with each cell containing daily records for maximum, minimum, and mean temperatures. Temperature anomalies for each grid cell were calculated relative to the 1991-2020 baseline and then mapped. Current state boundaries were overlaid on the gridded data to improve spatial interpretation and facilitate comparison of regional warming patterns across states.
[10] Decadal mean temperature anomalies were calculated by first estimating the annual mean temperature for each year from daily temperature values. The annual means were then averaged across the selected time period (e.g., 1970-1980 or 2015-2025) and then compared against the Long Period Average (LPA) of 1991-2020. Positive anomalies indicate decades that were warmer than the baseline average, while negative anomalies indicate cooler-than-baseline conditions.
[11] IMD and other meteorological services compute temperature anomalies by subtracting the mean temperature for a chosen baseline period from observed temperatures for the same month or year. Positive temperature anomalies indicate that observed temperatures are higher than the long-term average (baseline) for that period, while negative anomalies indicate temperatures below the historical baseline.
[12] Elevation-dependent warming refers to the tendency of high-altitude regions, particularly mountainous systems such as the Himalayas to warm faster than surrounding lowlands. This phenomenon is linked to factors such as declining snow and ice cover, changes in land-atmosphere feedbacks and shifts in atmospheric circulation. Rising temperature anomalies across the Himalayan and northeastern states may therefore have significant implications for glacier melt, water resources, ecosystems and the frequency of heat-related stress in regions that have historically experienced relatively moderate temperatures.
[13] Two Decades of Nighttime Surface Urban Heat Island Intensity Analysis over Nine Major Populated Cities of India and Implications for Heat Stress (2023), Madhavi Jain, Frontiers in Sustainable Cities / Frontiers.