Data For India's aim is to advance the understanding of India. This means helping people find answers to the questions that they have about India, whether big or small.
Much of our work involves big ideas - questions like 'What work do women in India do?' or 'How do Indians spend their money?' or 'What is going on with fertility in India?'. This work needs deep research, assembling massive datasets, and is shared on the platform as long insights with many charts. This is essential, satisfying work, and we have a long future of such work planned ahead of us.
However you, our readers, also sometimes have a short, single question. You want to know, for example, when India's population will stop growing, or what makes up India's GDP, or what the most common diseases now affecting Indians are. You've told us that you want this answer, with a chart that you can easily understand and share, but with the proper context and detail - not just a zombie number in a query result, that you can't really trust, and that you may not fully understand. We're now ready to solve that too.
Today, we are launching Data Bytes: one chart about India every week, and the story behind the data.
Every Monday, starting 6th July, a Data Byte will land right in your inbox, answering one simple question that you might have about India.
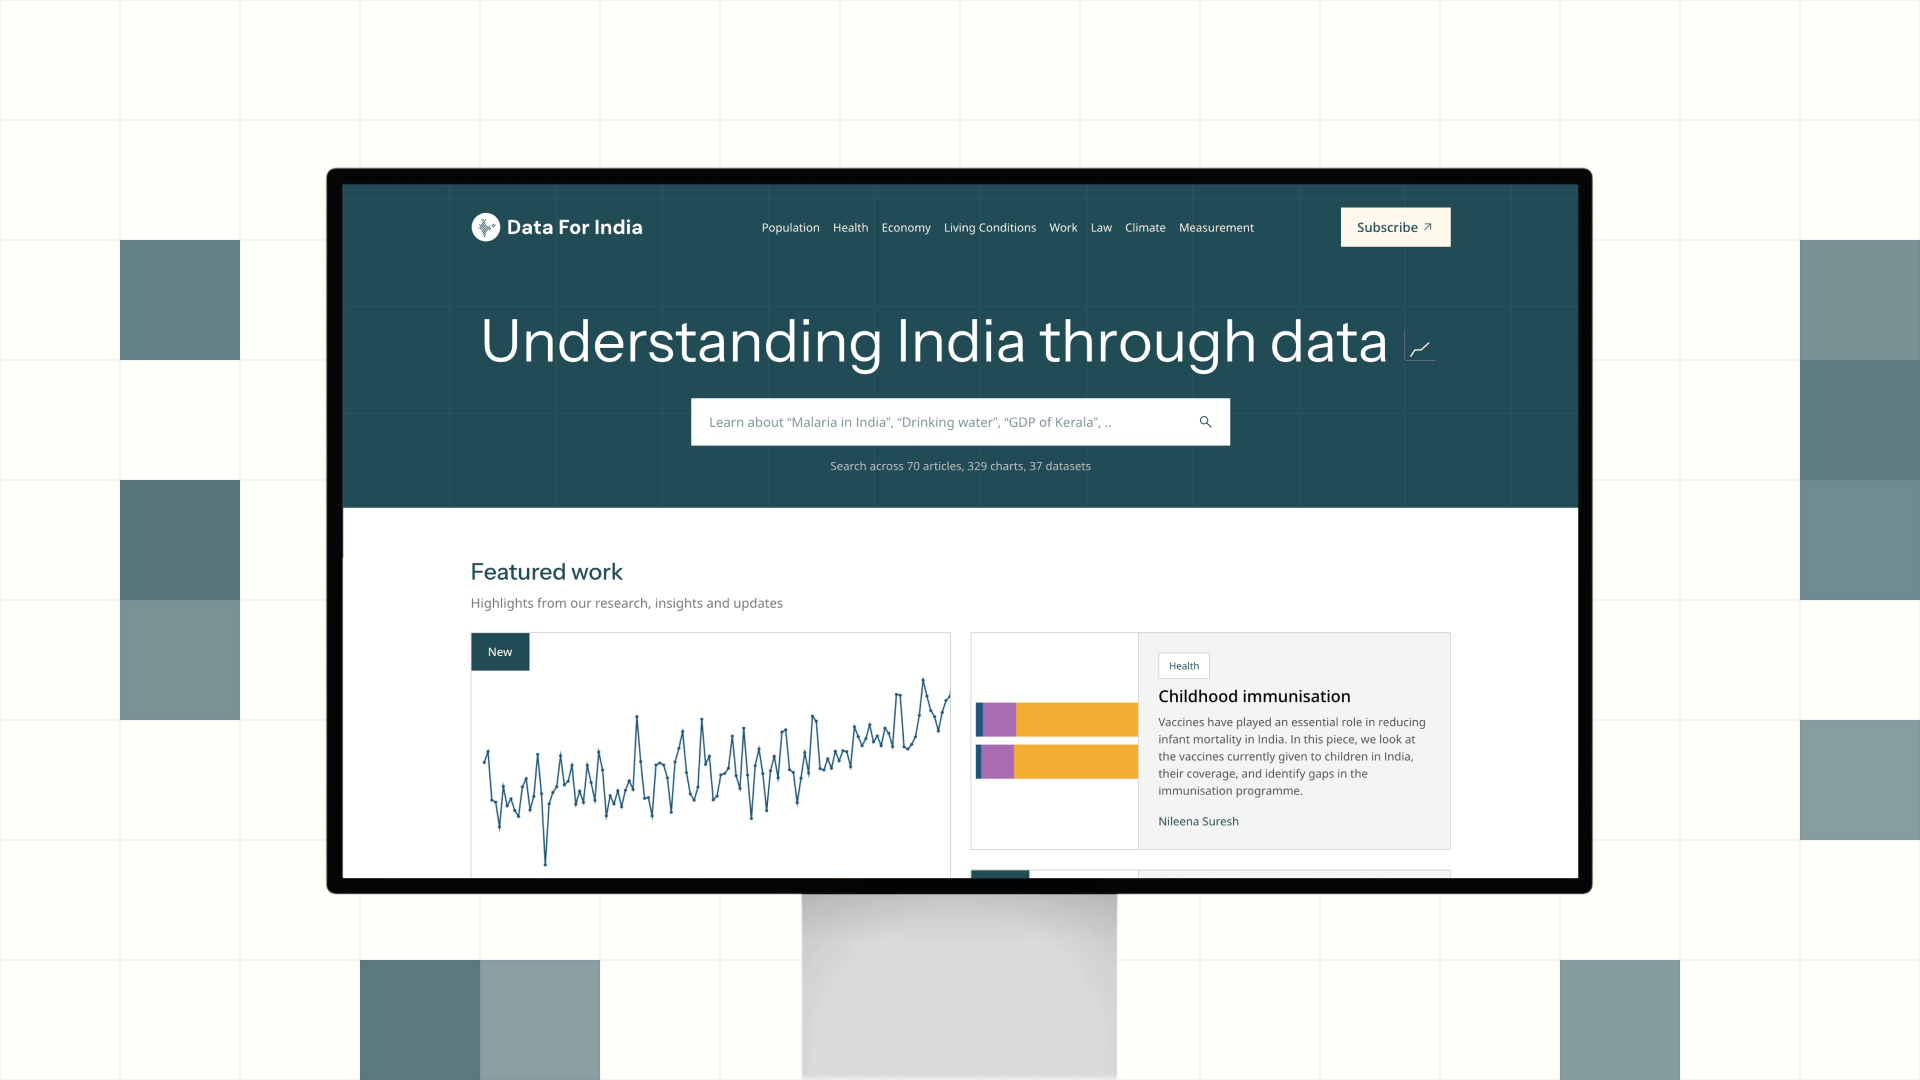
You will also find every Data Byte in one place on the Data For India platform, where you can browse and search for quick answers about India. As with everything we publish, Data Bytes are free to share, cite and republish with credit. Please see our guidelines for using our work for details.

Subscribe to receive the next Data Byte, right in your inbox.
A Data Byte might be short, but the process it takes to get there is deep. Our writers tap into the same deeply researched and meticulously assembled datasets that we rely on for all of our work. The only difference is that they go in with a smaller canvas - they train themselves to ask a sharper question and present it in a more concise manner. They also work on the same datasets and research at more length to produce more in-depth articles across our platform, which our Data Bytes will also link to for our readers to explore the topic further.
We'd love to hear your thoughts, and would be happy to take on questions that you might have from the data about India in future Data Bytes. Please write to us at info@dataforindia.com.
Finally, if you read a Data Byte that you like, share it with your friends, family or colleagues and help us advance the understanding of India, one data point at a time.