What sort of chart do you picture when you read the words: no change over time? Me, I picture a flat, unchanging line chart. So when we decided to look at rainfall trends in
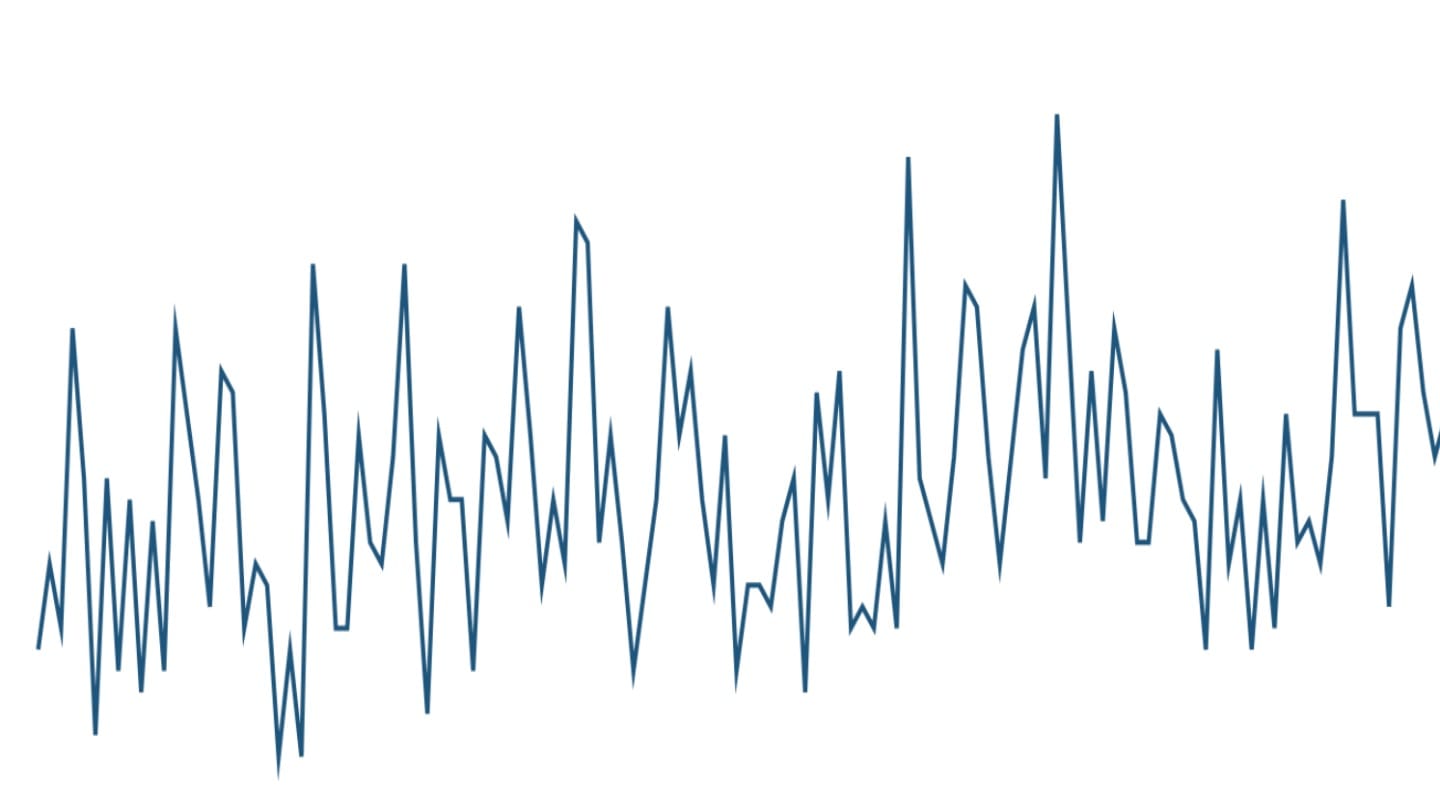
India and my colleague Juhi Chatterjee came back with the finding that annual cumulative rainfall in India has not changed in any statistically significant way over time, that's the chart I pictured. Except, it actually looks like this.
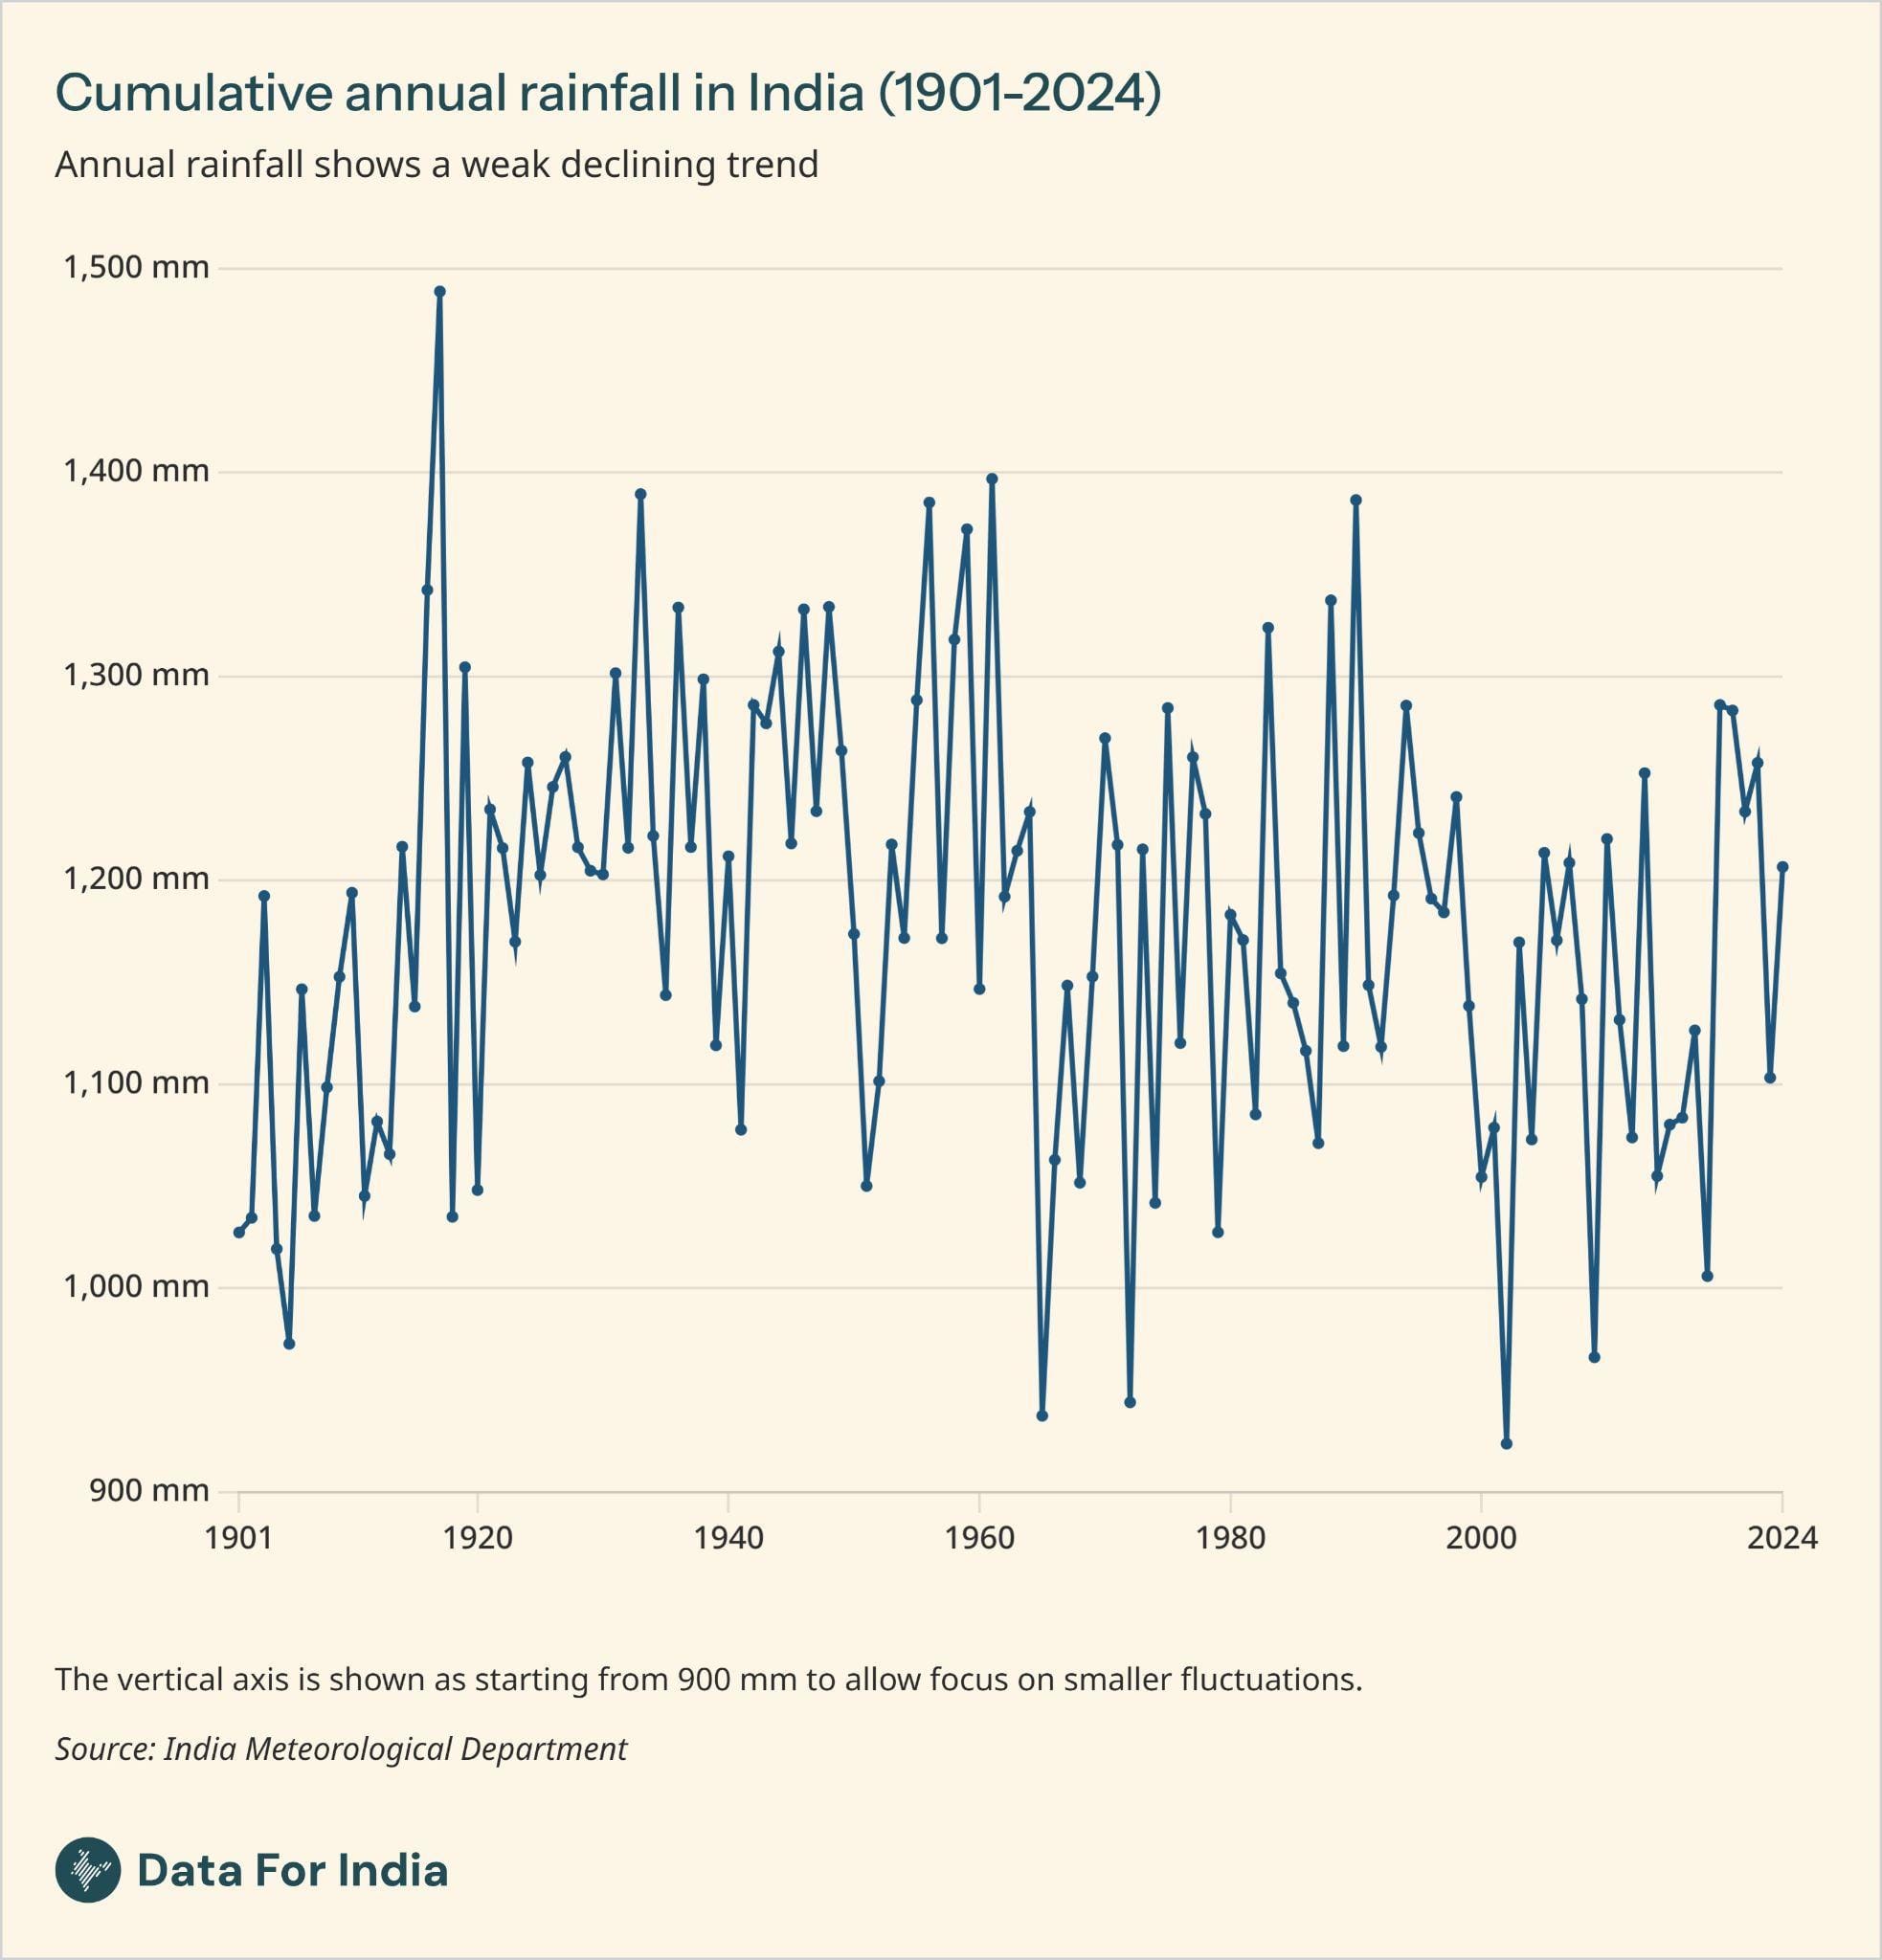
Before we get ahead of ourselves, here's what we're actually looking at: Rainfall data in India comes from observational records maintained by the India Meteorological Department. These datasets combine observations from thousands of rain gauges across India and extend back to 1901 making them among the longest rainfall records available for any tropical monsoon region. This chart looks at annual rainfall, but averaged out for the country. The vertical axis in this chart starts at 900 mm to allow us to look more closely at changes.
The key story it tells us is, as Juhi notes, is that "over the past century, there have been considerable year-to-year fluctuations, but the cumulative annual rainfall has remained broadly stable, showing only a weak and statistically insignificant decline. This marks India's annual rainfall patterns as distinct from its temperature trends, where we see a clear increase in average temperatures over time.
But the lack of a statistically significant change may not feel like one in our actual lives. We do not experience one year's rainfall as a data point in a 120-year time series; we experience it in relation to the previous year or years, or at most the previous few decades. And that's where that intense variability in the annual monsoon that you see in the graph above starts to feel very real.
That's also something you realise when you look at years classified as normal, below or above normal, or deficient or excess in terms of rainfall (see our work on long-term trends in rainfall for a full explanation of how years are classified). Just one of the last ten years, for instance, is classified as normal.
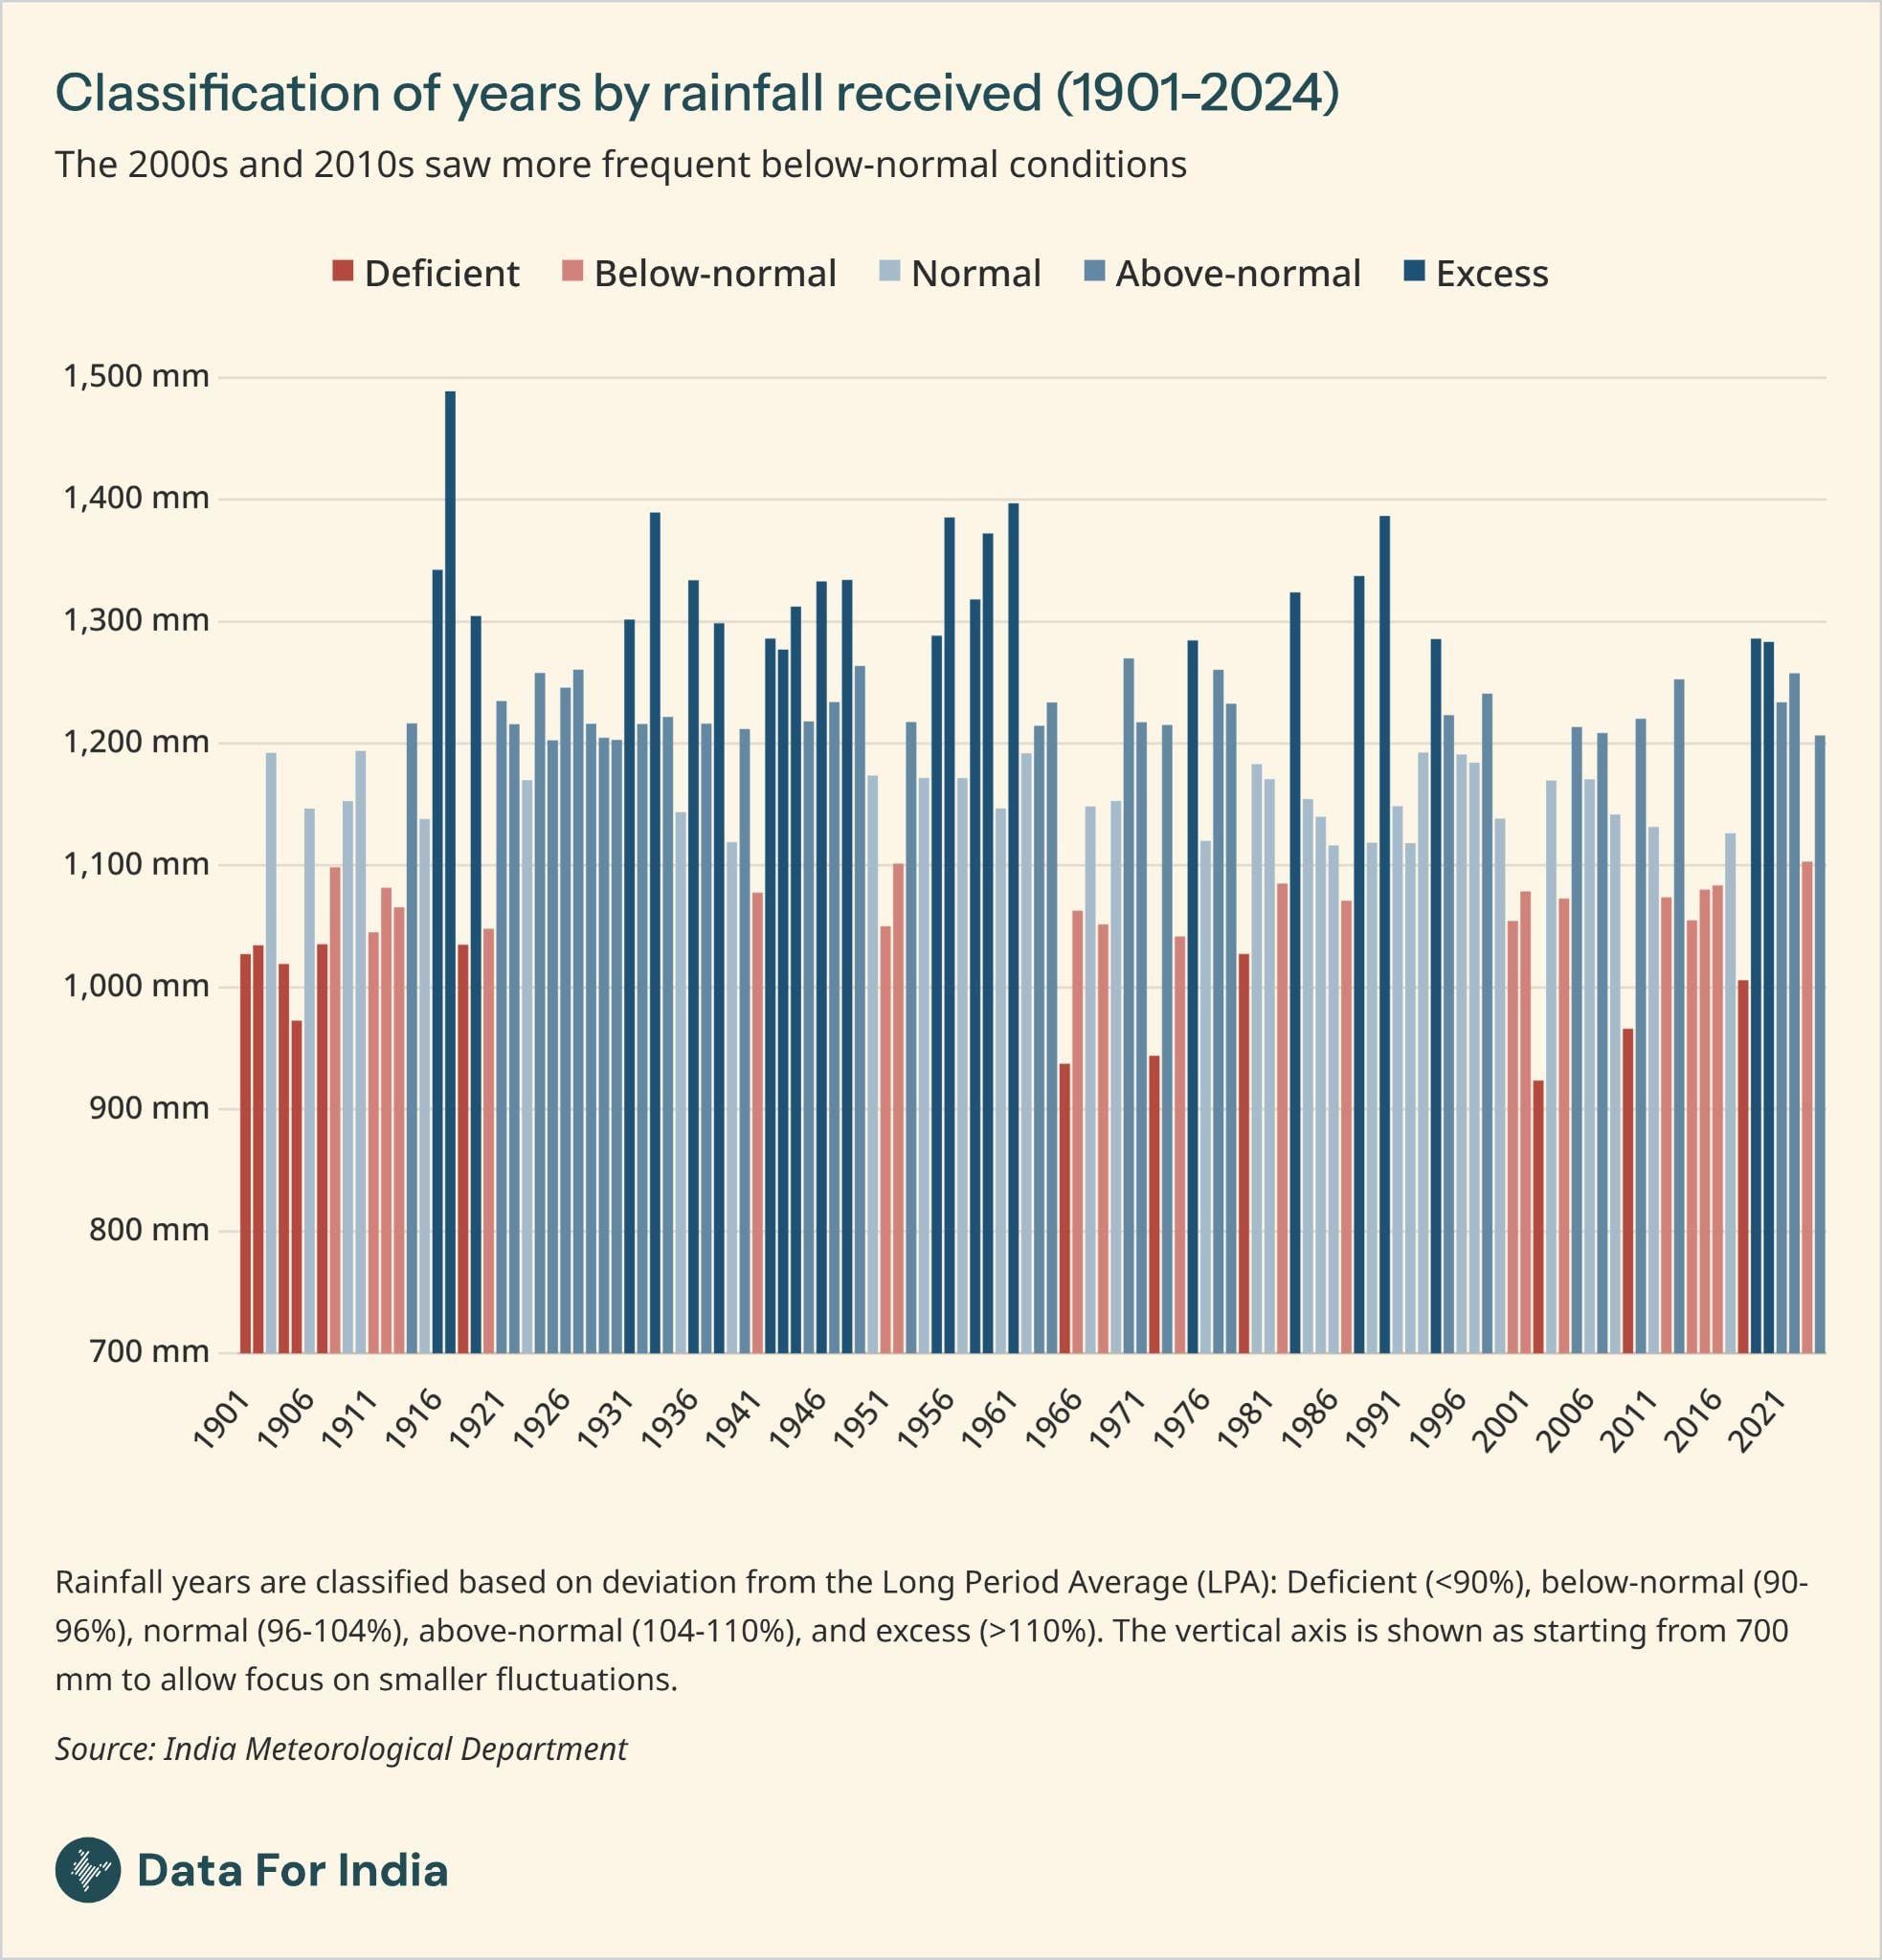
Little may have changed in terms of long-term trends in total rainfall, but things may not feel very stable at all for us mere humans living through the highs and lows of each of these years. This doesn't mean that long-term trends don't matter - situating short-term volatility into a more zoomed-out view can help understand both big shifts as well as the current moment. Looking at the big shifts alone, though, may offer cold comfort: in the long run, as John Maynard Keynes said, we are all dead.