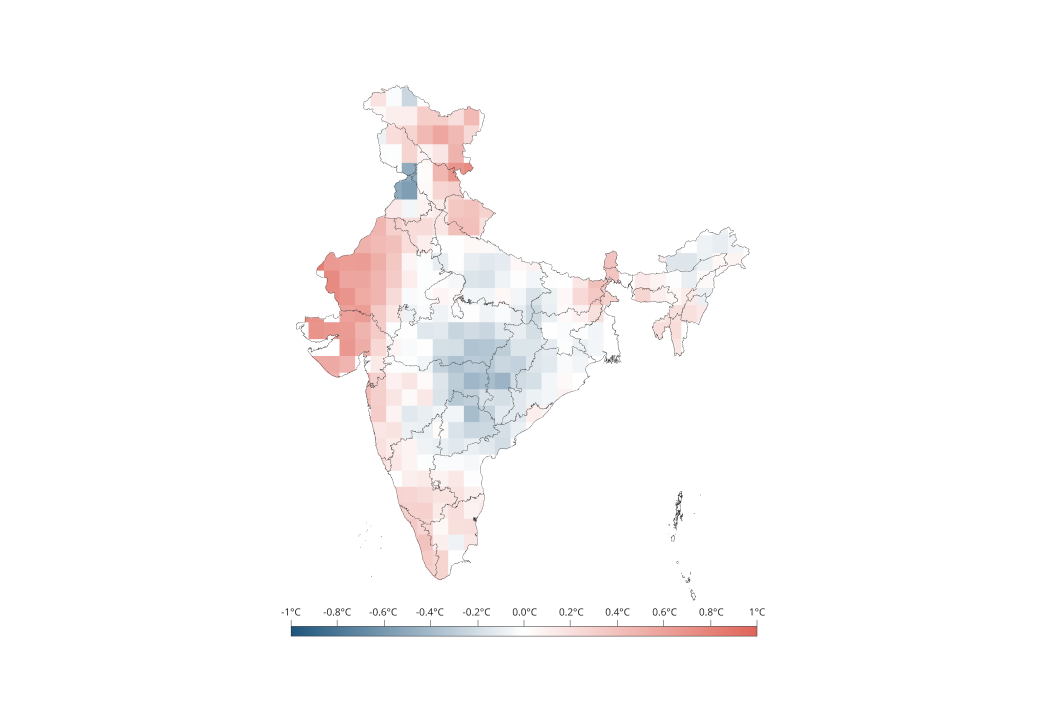
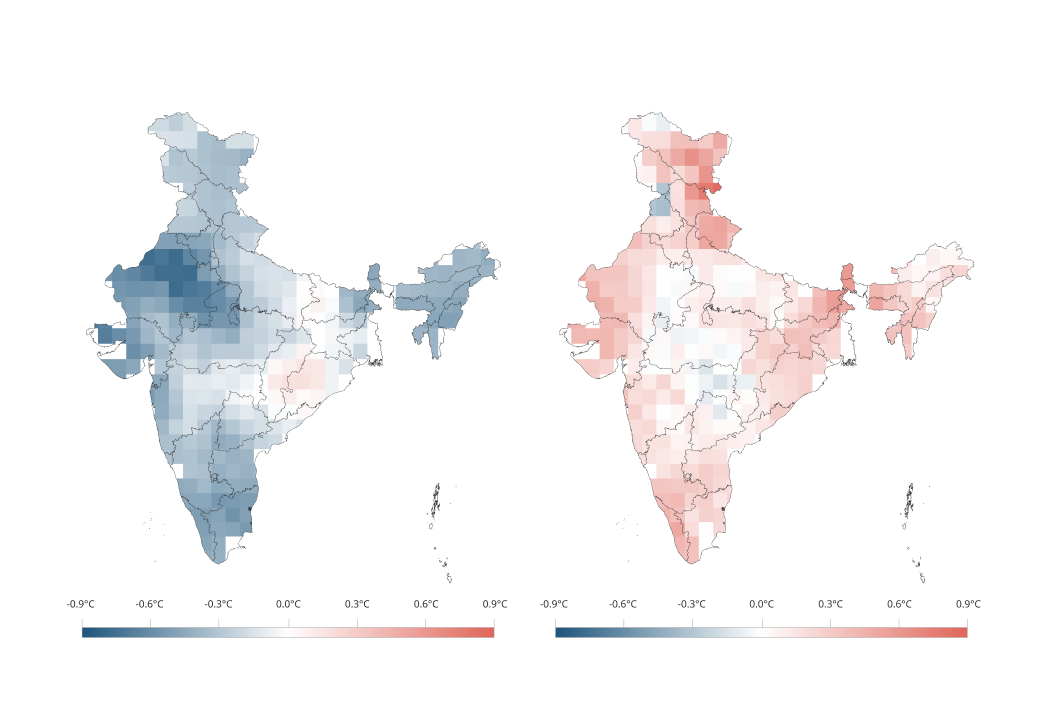
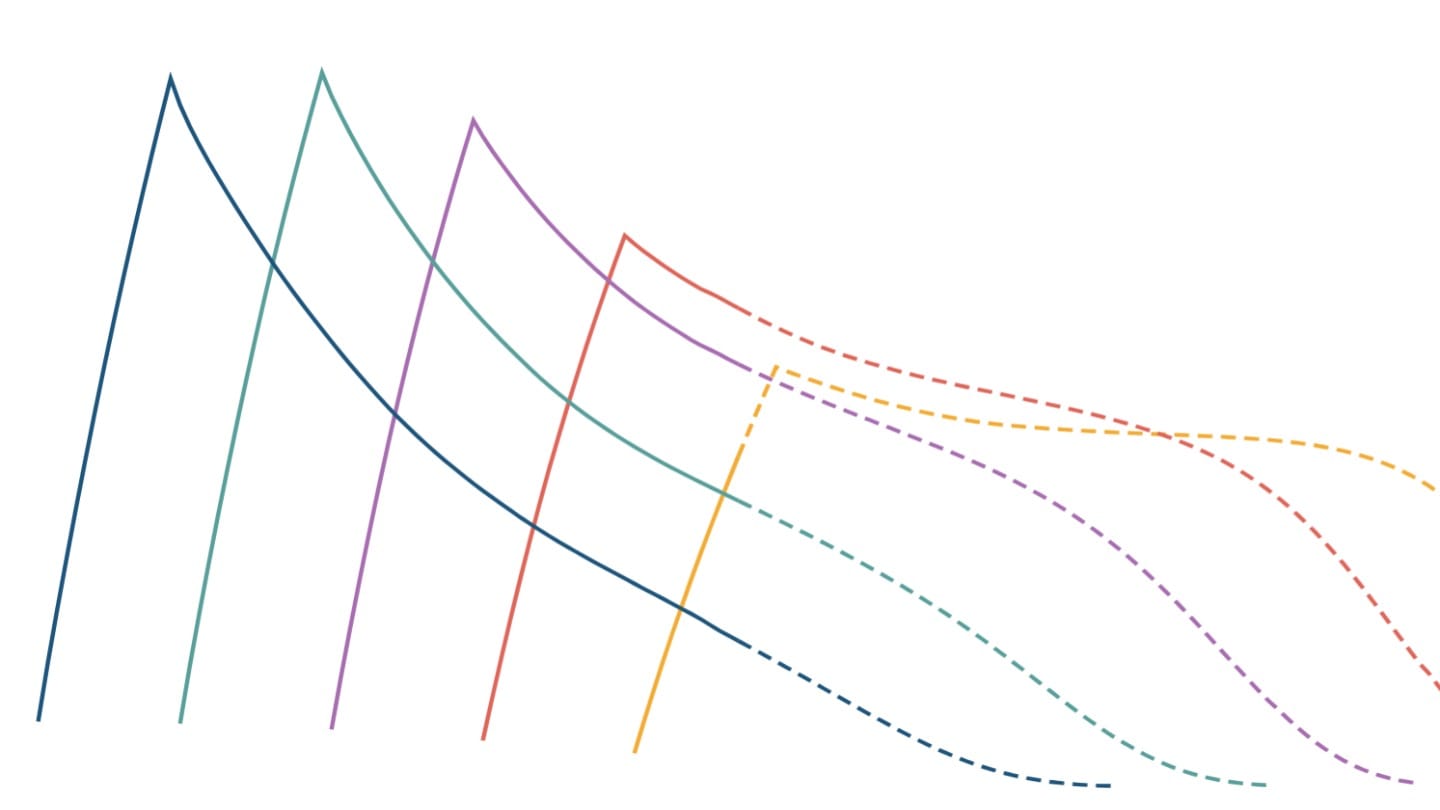
India is warming, but the rise in temperatures is not uniform across seasons.[1] Warming has become increasingly concentrated in specific seasons with some seasons warming much faster than others. This seasonal asymmetry is critical because India's economy and livelihoods remain dependent on climate-sensitive sectors. Understanding how warming differs across seasons is therefore essential for designing targeted adaptation strategies and improving preparedness for climate-related risks.
We obtain seasonal temperatures by using observational data provided by the India Meteorological Department (IMD) based on the following standard seasonal definitions: pre-monsoon (March-May), monsoon (June-September), post-monsoon (October-December) and winter (January-February).[2]
Changes in seasonal temperatures over time
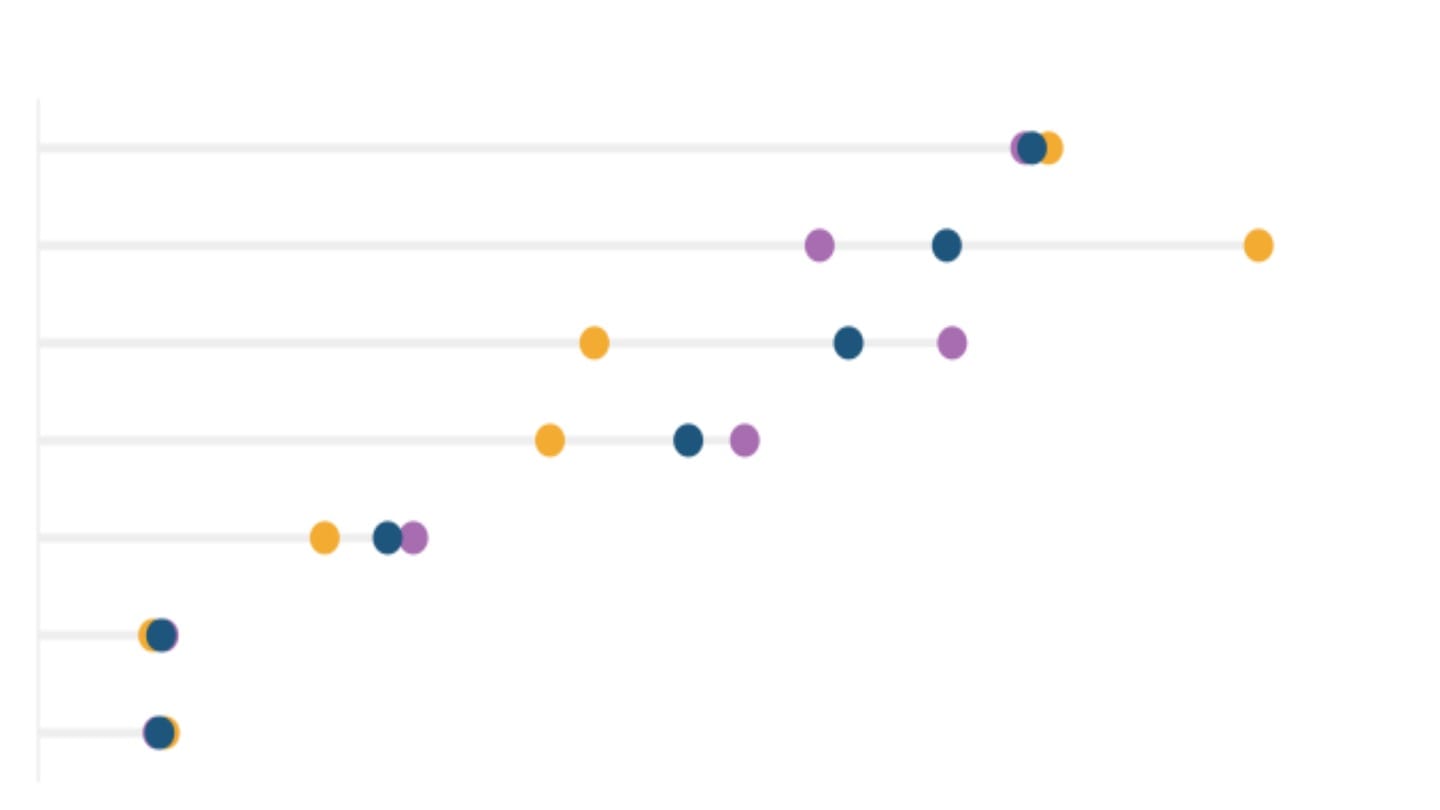
Seasonal temperatures in India vary considerably over the course of the year. Over the period of 1901-2024, the monsoon season was the hottest with an average mean temperature of 27.8°C, followed closely by the pre-monsoon season at 27.5°C. Temperatures decline during the post-monsoon season to an average of 22°C before reaching their annual minimum of approximately 19°C in winter.
While these long-term averages describe the seasonal climate, they do not capture how each season is changing over time. To understand whether the climate is changing, temperatures need to be compared against their historical average for each season.
Measuring changes in seasonal temperature
This analysis uses the IMD temperature dataset covering the period 1901-2024 to examine changes in mean temperatures and temperature anomalies across India.[3] As temperatures naturally vary across India due to differences in geography, elevation and proximity to the coast, seasonal temperature anomalies - departures from the long-term average - provide a more consistent basis for comparing warming across regions and time periods.[4]
The IMD and other meteorological services compute temperature anomalies by subtracting the mean temperature for a chosen baseline period from observed temperatures for the same season or month. Positive temperature anomalies indicate that observed temperatures are higher than the long-term average (baseline) for that period, while negative anomalies indicate temperatures below the historical baseline. The 1991-2020 period has been adopted as the most recent global climatological normal and is the current standard for operational reporting by many countries including India.[5] This period represents the current official baseline used in IMD climate reporting and reflects the most recent 30-year average climate conditions in India.
Shifts in seasonal anomalies
Mean temperatures show statistically significant warming across all four seasons over 1901-2024. While public conversation around warming is often centred around the summer months, our analysis of the data finds that the post-monsoon and winter seasons show significant warming, higher than seen in the pre-monsoon season.
2024, which was the warmest year in the observational record since 1901 with a temperature anomaly of +0.65°C (relative to the baseline of 1991-2020), underscores this seasonal asymmetry. The seasonal contributions to this warmth, however, were not uniform. The post‑monsoon season recorded the largest positive anomaly among the four seasons at +0.83°C, marginally exceeding the annual average, while the monsoon season followed with an anomaly of +0.71°C. The pre‑monsoon or summer season, on the other hand, recorded a smaller positive anomaly of +0.56°C. The winter season, although warmer than its long‑term average, demonstrated the smallest positive anomaly at +0.37°C.
Post-monsoon: intensified warming and warmer nights
The post-monsoon season shows the strongest rate of long-term warming among all seasons, with mean temperatures increasing by 0.10°C per decade over 1901-2024. The warming trend is statistically significant and is accompanied by a clear shift towards positive temperature anomalies in the later part of the record.
Unlike the monsoon, however, much of the post-monsoon warming is being driven by rising minimum temperatures, which have increased at around 0.06°C per decade. This indicates that nights are warming faster than days during the period of transition from the monsoon into winter.
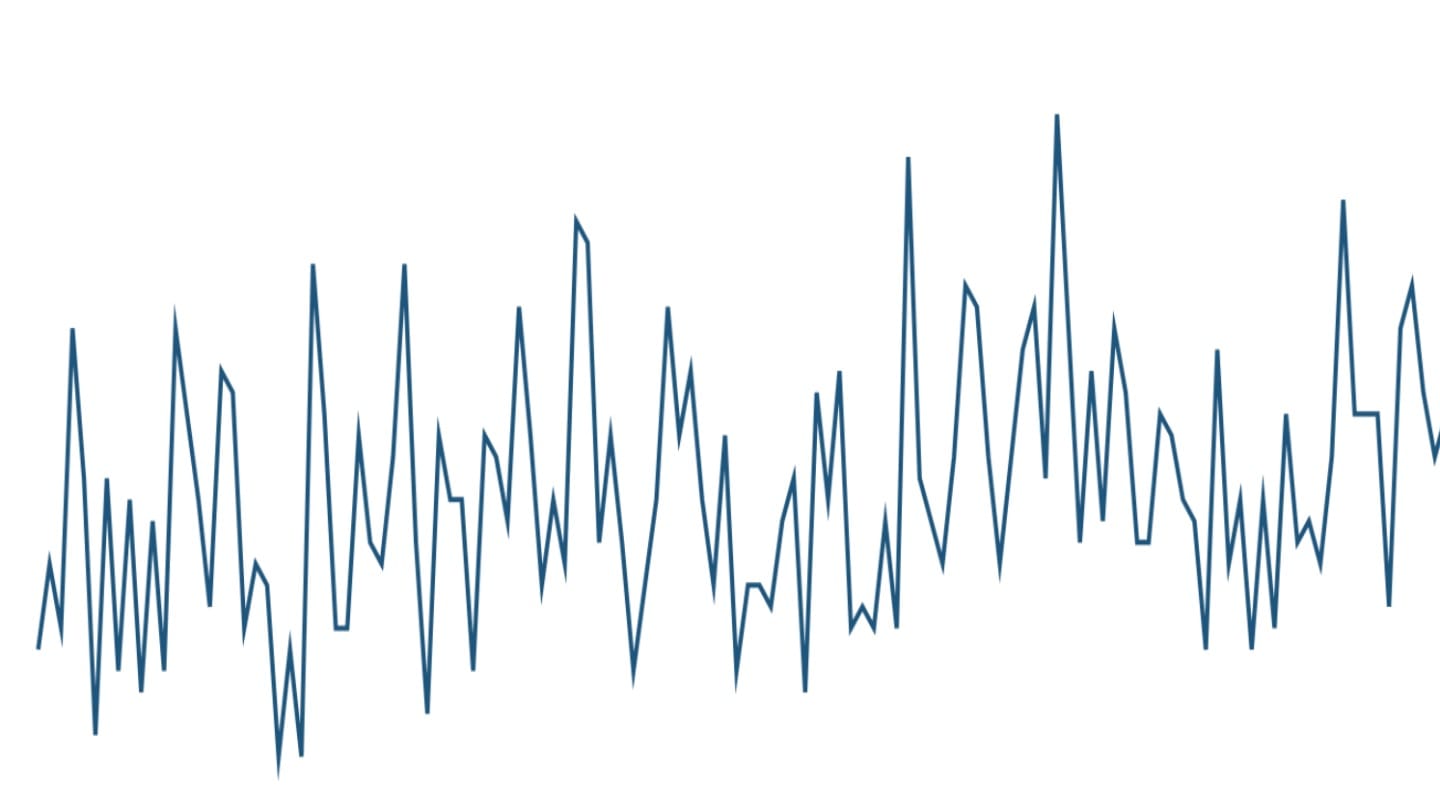
Negative anomalies were frequent from the 1960s through the 1980s, with some years recording departures of around -1.5°C from the 1991-2020 baseline. Positive anomalies subsequently became more frequent, with several years after 2000 recording departures above +0.4°C. The largest recent positive anomalies were around +0.83°C in 2024, +0.77°C in 2023 and +0.66°C in 2015. Rather than isolated warm years, the post-monsoon now shows a sustained shift towards warmer conditions, making elevated post-monsoon temperatures increasingly characteristic of the season.
Warmer post-monsoon nights can delay seasonal cooling, influence soil moisture and crop development, increase cooling demand and alter the timing of the transition into winter.[6]
Monsoon warming: acceleration in recent decades
The monsoon season has seen a statistically significant long-term shift in seasonal mean temperature anomalies.
In the earlier part of the record, negative anomalies occur more frequently and several years fall substantially below the baseline. Before 1990, monsoon anomalies were predominantly negative, indicating temperatures below the current climatological normal. Since the late 1990s, however, the anomaly distribution has shifted towards positive values with the frequency and magnitude of positive anomalies increasing further after 2010.
Recent years, including 2014, 2019, 2023 and 2024, rank among the warmest monsoon seasons in the dataset. This persistent concentration of positive anomalies indicates that the monsoon climate has shifted to a warmer baseline rather than simply experiencing occasional extreme years. Given the central role of the southwest monsoon in agriculture, higher monsoon temperatures are likely to increase evapotranspiration, crop water demand and heat stress during the growing season, even in years with near-normal rainfall.
Mean monsoon temperature anomalies have increased by approximately 0.05°C per decade. Maximum daytime temperatures during the monsoon have risen even faster at 0.07°C per decade. Both trends are statistically significant, indicating that monsoon warming is being driven largely by hotter days.
Winter and pre-monsoon: substantial variability around underlying warming trend
Winter temperatures in India have risen significantly since the beginning of the 20th century, with the warming trend becoming more evident in recent decades. Between 1901 and 2024, winter temperatures increased at an estimated 0.07°C per decade. The annual temperatures show a marked shift from predominantly negative anomalies before 2000 to more frequent positive anomalies in the recent decades. The highest anomaly was +1.05°C in 2016, while several years since 2000 have recorded anomalies above +0.5°C. Winter anomalies ranged from -2.54°C to +1.05°C, a spread of about 3.6°C, highlighting the substantial variability around the long-term warming trend.
India's pre-monsoon - or summer - temperatures have also risen significantly over the long term, although the data shows considerable year-to-year variability.
The pre-monsoon season has an average anomaly of 0.06°C relative to the 1991-2020 baseline, indicating a warming trend over the period. Negative temperature anomalies were more common during the earlier decades, with the lowest anomaly of -2.06°C recorded in 1917. In contrast, positive anomalies have become more frequent in recent decades with the highest pre-monsoon anomaly of +1.14°C recorded in 2010, followed by an anomaly of +1.02°C in 2022.
Why the timing of warming matters
India's temperatures have increased across all four seasons, but the pace and spatial pattern of warming vary considerably. The post-monsoon shows the most robust long-term warming trend, while the monsoon season is also shifting towards warmer conditions. These differences matter because the timing of warming determines its impacts. Higher monsoon temperatures can increase crop water demand and heat stress during the growing season, and warmer post-monsoon conditions can delay seasonal cooling. Understanding when and where temperatures are changing is therefore essential for moving beyond national averages and designing climate adaptation strategies that reflect the specific risks faced during different seasons.
[1] Temperature Changes in India (2020), Sanjay et al., in Assessment of Climate Change over the Indian Region / Ministry of Earth Sciences, Government of India and Springer.
[2] Meteorological Glossary (n.d.), India Meteorological Department, Climate Research and Services, Ministry of Earth Sciences, Government of India.
[3] India's surface air temperature data is sourced from the India Meteorological Department's (IMD) national observation network comprising over 500 manual observatories and more than 1000 Automatic Weather Stations (AWS). While advancements in instrumentation and an expanding network of monitoring stations have significantly enhanced data accuracy, long-term climate analyses rely on quality-controlled subsets of several hundred stations with continuous records. For long‑term climate analysis, the IMD uses a homogenised subset of approximately 700 stations with continuous records. Each station records daily maximum and minimum temperatures, contributing roughly 1,460 data points per station annually. This translates to over 500,000 station‑level observations per year that form the basis of the gridded dataset.
[4] WMO Guidelines on the Calculation of Climate Normals (WMO-No. 1203), (2017). World Meteorological Organization (WMO).
[5] IMD's New Normal for the Period 1991-2020 (2021). India Meteorological Department, Ministry of Earth Sciences, Government of India.
[6] Climate Change 2022: Impacts, Adaptation and Vulnerability, Chapter 10: Asia (2022), IPCC, Working Group II, Sixth Assessment Report.