Welcome back to The Roundup, Data For India’s monthly newsletter bringing you our latest work, new features and major updates, right into your inbox.
In this month’s edition: a closer look at India’s e-courts data, new work on employment, weather and population, and where to meet the team in Bengaluru and Chennai.
The Spotlight
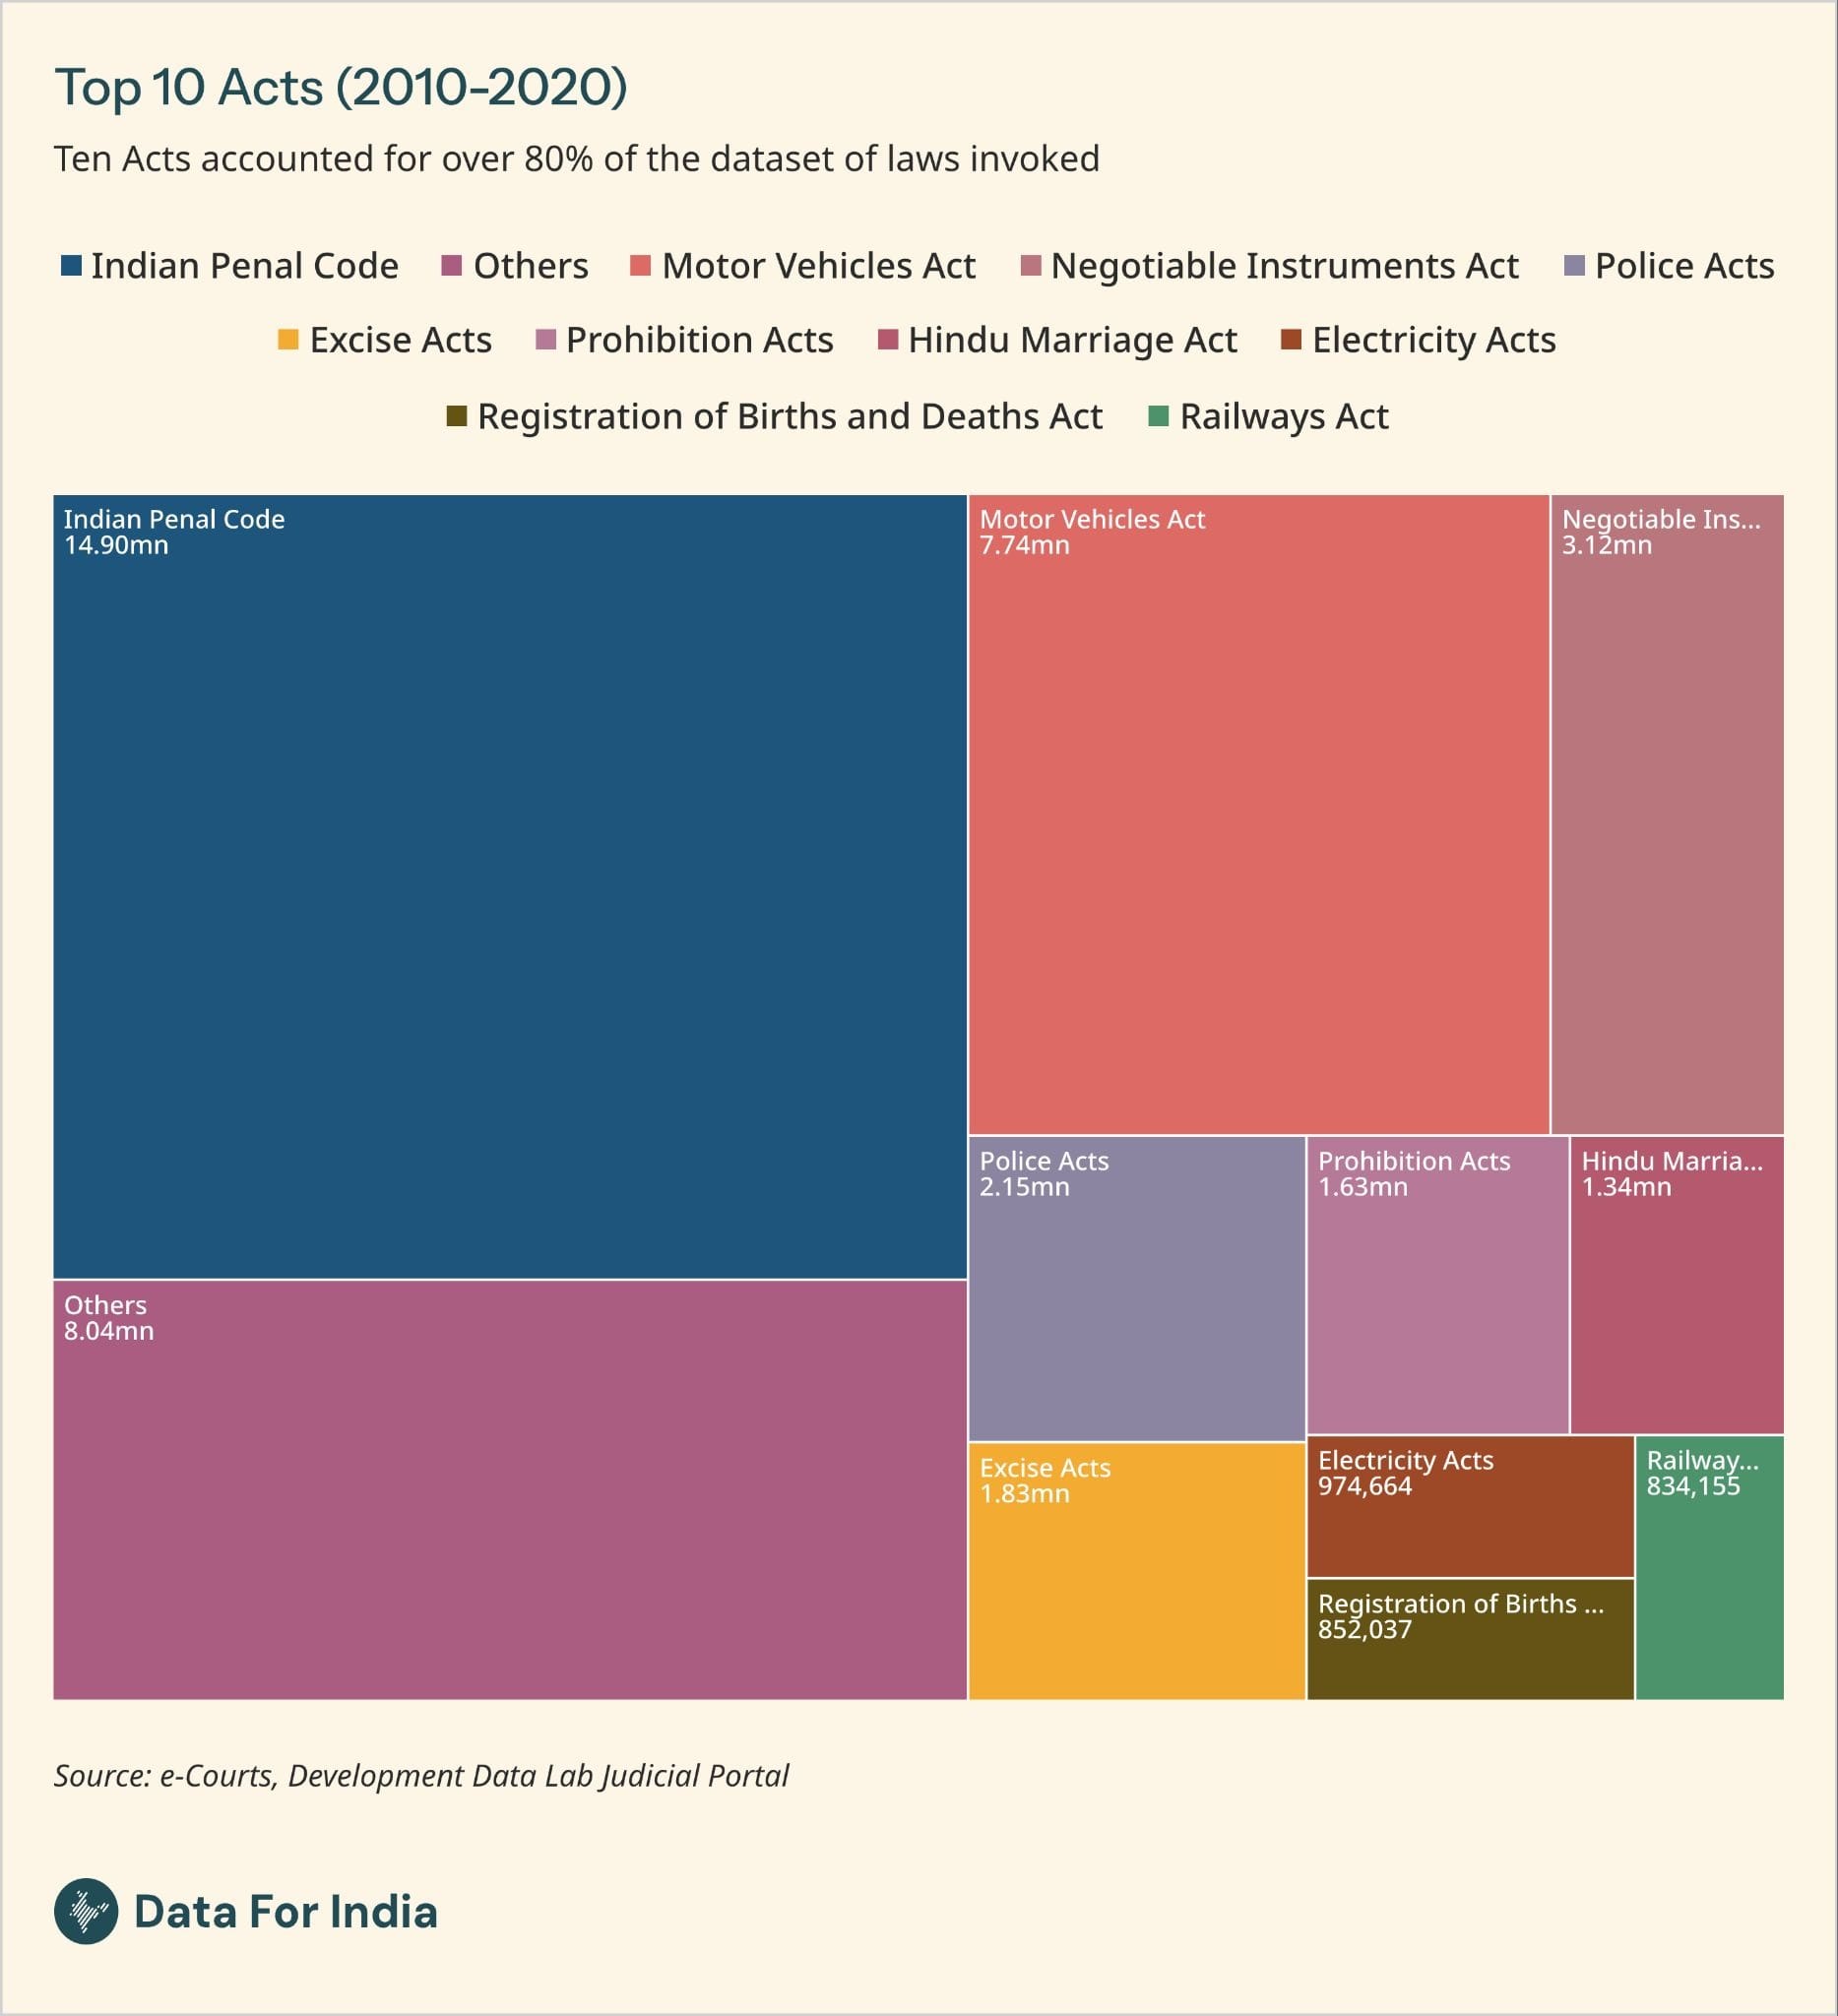
What India’s e-courts data reveals
Understanding how the law works in practice requires more than aggregate figures on pending cases and conviction rates. Sources such as National Crime Records Bureau reports offer some data on criminal cases, but little about the people involved, how cases progress, the evidence presented or courts’ reasoning. They also have no information about civil disputes, and accessing physical court records has long been difficult and time-consuming.
India’s e-courts project allows researchers to study both civil and criminal cases in a way that was previously impossible, from how laws are used and cases progress to court performance and outcomes. It provides public access to information on roughly 300 million cases and nearly 400 million orders and judgments across district courts, High Courts and the Supreme Court.
Yet the data remains difficult to use at scale because of gaps in accuracy, completeness and standardisation, as well as concerns about sensitive personal information. Read Ameya Bokil’s piece for our measurement vertical on India’s e-courts data to learn what the data contains, how researchers have used it, and what needs to improve for it to become a more reliable public resource.
New On The Platform
- Is India’s workforce feminising? Women’s participation in the workforce has risen sharply since 2018, driven largely by rural and agricultural employment. Nileena Suresh asks whether that growth has translated into better-paying, higher-quality jobs.
- Regional variations in seasonal temperatures. Winter warming is now the most widespread across India, while the monsoon shows the clearest sustained long-term trend. Juhi Chatterjee maps how these patterns vary by season and region.
- Seasonal changes in daily rainfall patterns. Looking beyond seasonal totals, Juhi Chatterjee examines how often rain falls and how intense it is. The clearest changes appear pre-monsoon, while monsoon totals remain broadly stable despite increasingly intense multi-day rainfall.
- India’s Gen Z is a shrinking demographic. As fertility falls, India’s younger generations are losing their demographic dominance. Rukmini S shows that the population aged 15–29 is projected to begin shrinking in 2026, for the first time in the country’s history.
One Thing To Try
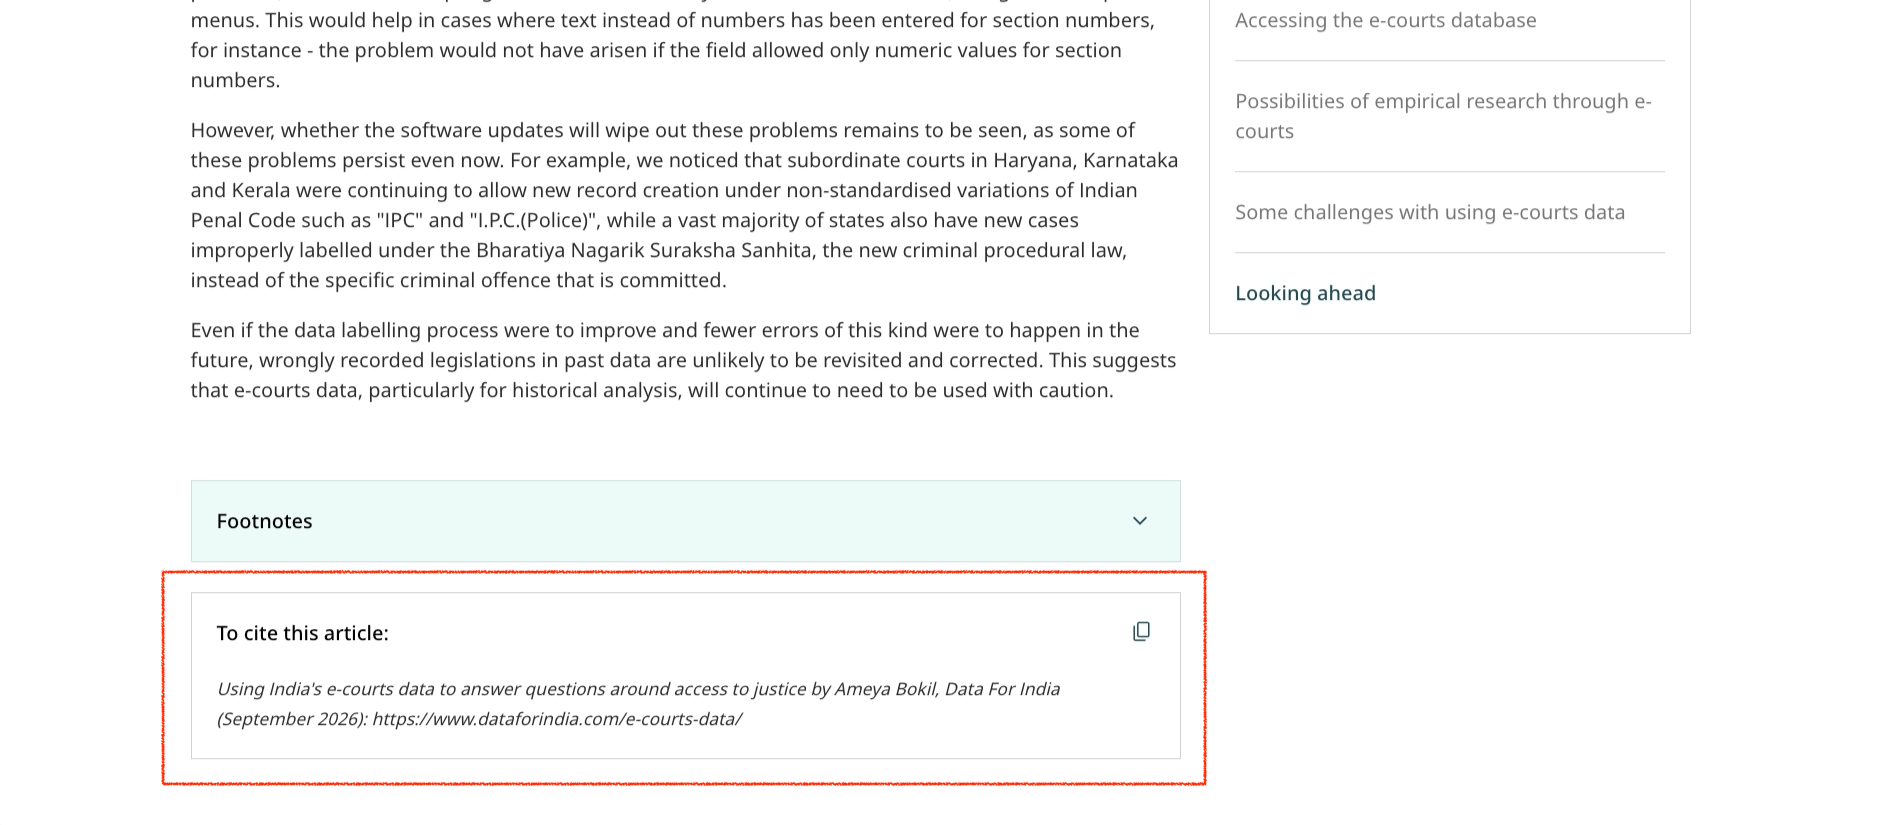
Cite our work without starting from scratch
Data For India’s work is meant to be shared and used widely. Our articles, charts and data are published under a Creative Commons Attribution 4.0 licence, so you do not need to ask for permission. You only need to credit Data For India and link to the original work.
Every article includes a ready-to-use citation at the bottom. If you use one of our charts as an image, embed or link, cite the article it comes from. The citation includes the title, author, publication and link, so the information you need is already in one place.
Read our short guide to using and citing our work. In case you have used our work already, reply to this email and let us know about it.
Conversations We Joined
- Apoorv Anand joined a People’s Digital Goods and Infrastructure workshop in Bengaluru on September 4. Participants mapped the stakeholders and steps involved in developing a PDGI manifesto.
- At a NALSAR in Dialogue session in Hyderabad on September 11, Rukmini S and Professor Adithya Chintapanti discussed what India’s headline socio-economic indicators represent and why understanding their context matters.
- Also on September 11, Abhishek Waghmare joined the XKDR Forum’s {X}ray of State Finances Roundtable in Mumbai. The roundtable examined what detailed fiscal data can reveal about state finances and marked the release of the India Public Finance Portal.
Come meet us in Bengaluru
- Nileena Suresh and Arpit are setting up a booth on September 26-27 at IndiaFOSS 2026 on “the last mile of public data”. Together, we will explore what stands between data being publicly available and being genuinely usable. Come meet us at NIMHANS Convention Centre, Bengaluru, on the ground floor!
- Also at IndiaFOSS 2026, Rukmini S will give a talk, “Telling India’s Story Through Data”, on Sunday, September 27, at 11:45 am in Hall 1of NIMHANS Convention Centre, Bengaluru.
- Rukmini S will speak at DesignUp 2026 on October 4, at 2 pm about how data can shape, and sometimes unsettle, the way we see India and the design decisions that follow.
Come meet us in Chennai
- Rukmini S is giving a Pint of View lecture over drinks on What Data Can and Cannot Tell Us About Modern India in Chennai on Sunday, October 25. Get your tickets.
Where Our Work Travelled
- The Wire republished Nileena Suresh’s piece on India’s feminising workforce, bringing its findings on women’s employment and job quality to their audience.
- Mint referenced Pramit Bhattacharya’s explainer on how India’s GDP adds up in its coverage of India’s latest GDP estimates.
- Writing for the Center for the Advanced Study of India at the University of Pennsylvania, Rukmini S examined why India’s population of young people is beginning to shrink and what that means for Gen Z.
Talking Point
One chart worth sitting with this month, from a Data For India team member.
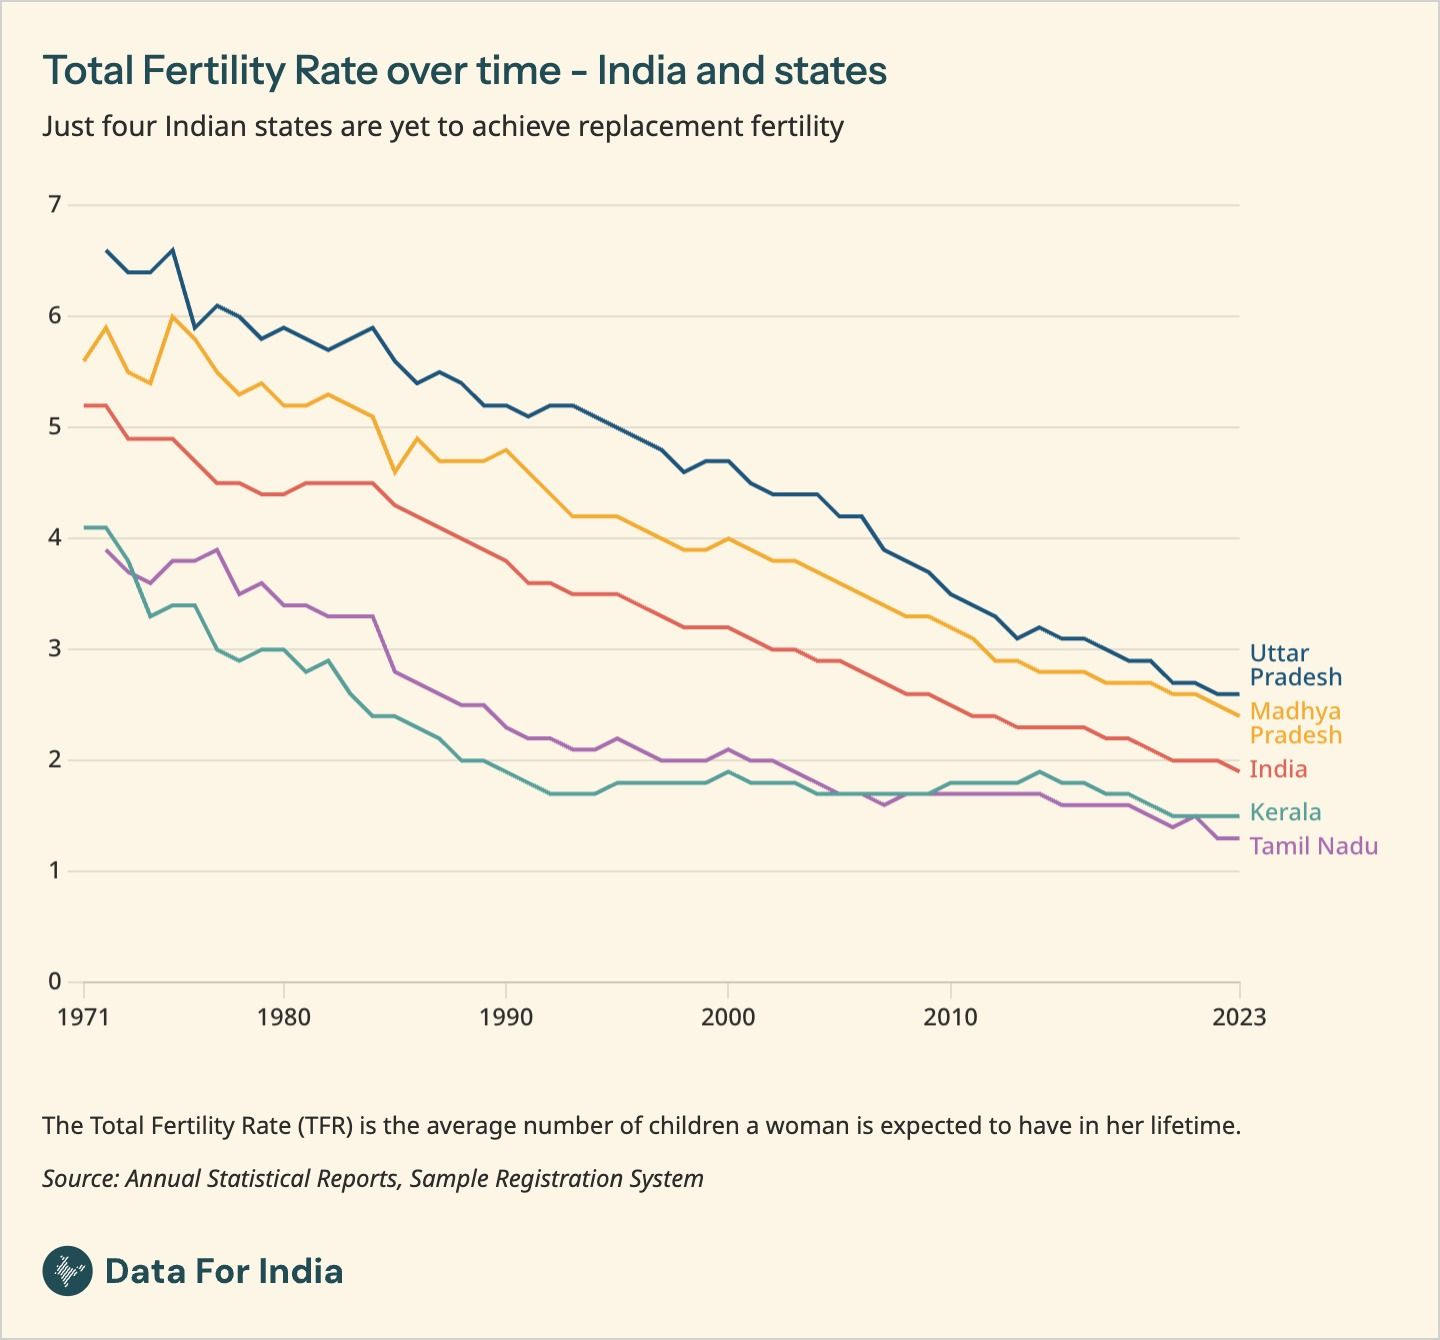
India’s Total Fertility Rate recently dropped below the replacement fertility level of 2.1, but the national figure masks wide variation across states. States have reached this point at different times and speeds. While most states are now below replacement fertility, Bihar, Uttar Pradesh, Madhya Pradesh and Rajasthan are still above it. The uneven pace of fertility decline will shape how states experience population growth and the demand for public services and jobs.
– Juhi, Researcher and Writer
That’s it for the September 2026 edition of The Roundup. If you are in Bengaluru or Chennai, come meet the Data For India team.
You can also reach out to us by replying to this email or writing to us at info@dataforindia.com. See you again on the last Friday of next month.