India's climate is shaped by a diversity of landscapes influenced by factors such as latitude, elevation, land use, proximity to the coast and atmospheric circulation systems. These geographical differences mean that climate change is unlikely to affect all regions in the same way or at the same rate.[1] India has experienced a pronounced warming trend in surface temperature with regional amplification in certain regions. Some regions are warming faster than others, while the timing and intensity of warming also differ across seasons.[2] Such variations have important implications for agriculture, water resources, ecosystems, energy demand and human health, all of which are closely linked to seasonal weather and climatic conditions.[3]
Using daily gridded temperature observations from the India Meteorological Department (IMD), this analysis maps seasonal mean temperature anomalies across India during 2015-2025 relative to the 1991-2020 climatological normal. Although climate change is typically assessed over much longer periods, examining the most recent decade provides insight into emerging regional patterns. The period since 2015 includes many of the warmest years recorded in India, making it particularly useful for identifying where recent warming has become concentrated.
Seasonality in India
This analysis uses IMD's daily gridded temperature dataset available for the period 1951-2025.[4] Three temperature indicators are analysed: minimum temperature (night-time conditions), maximum temperature (daytime heat) and mean temperature (overall seasonal warming).[5] Daily observations were aggregated into the four standard IMD seasons:
- Pre-monsoon: March-May
- Monsoon: June-September
- Post-monsoon: October-December
- Winter: January-February.[6]
To assess recent patterns of warming, the analysis uses temperature anomalies, which measure departures from a climatological baseline rather than absolute temperatures. Temperature anomalies depend on a clearly defined and standardised baseline. The IMD follows World Meteorological Organization (WMO) guidelines in defining a climatological normal as the average of a climate variable over a continuous 30-year period. Because temperatures naturally vary across India due to differences in geography, elevation and proximity to the coast, anomalies provide a more consistent basis for comparing warming across regions and time periods.[7]
These baselines are updated every decade to ensure that "normal" conditions reflect the most recent climate context and provide relevant reference points for climate monitoring and operational decision-making.[8] The 1991-2020 baseline period represents the current official baseline used in IMD climate reporting and reflects the most recent 30-year average climate conditions in India.[9]
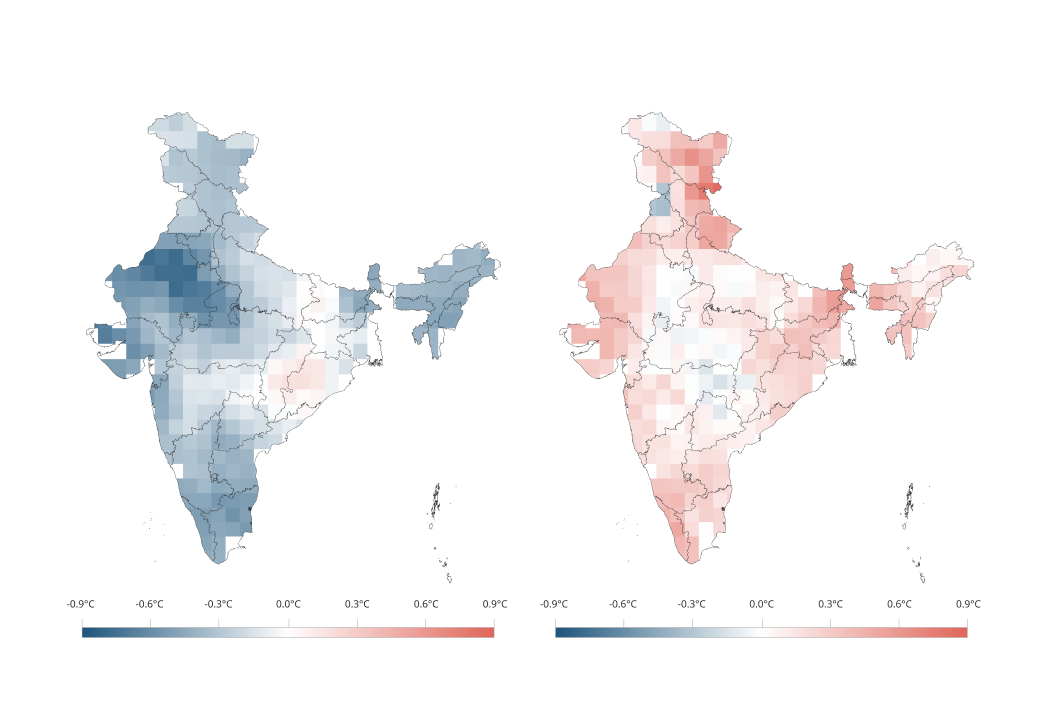
These anomalies have been presented in the form of maps,[10] comparing decadal mean temperature anomalies across India for 2015-2025 with the 1991-2020 climatological baseline.[11] Negative anomalies (shown in blue) indicate temperatures cooler than the baseline average, while positive anomalies (shown in red) indicate warmer-than-baseline conditions.[12]
Warming becomes more widespread
The seasonal maps reveal that warming is now evident across most of India, but its intensity and spatial distribution vary considerably through the year. Rather than remaining fixed, warming hotspots shift geographically from one season to the next.
Winter: uniform warming across the country
Winter shows the most spatially uniform warming of all four seasons. Unlike the other seasons, where pockets of below-average temperatures remain, winter maps show positive anomalies across almost the entire country. This means that our winters are becoming warmer and this trend is consistent with nearly all states showing temperatures above the 1991-2020 average.
The strongest warming is observed across north-western India with parts of Rajasthan, Gujarat, Punjab, Haryana, Himachal Pradesh and Jammu and Kashmir and Ladakh recording some of the highest anomalies exceeding +0.5°C, and locally approaching +1.1°C. Central and southern India including Maharashtra, Telangana, Andhra Pradesh, Karnataka, Tamil Nadu and Kerala show smaller positive anomalies in the range of approximately +0.2°C to +0.5°C.
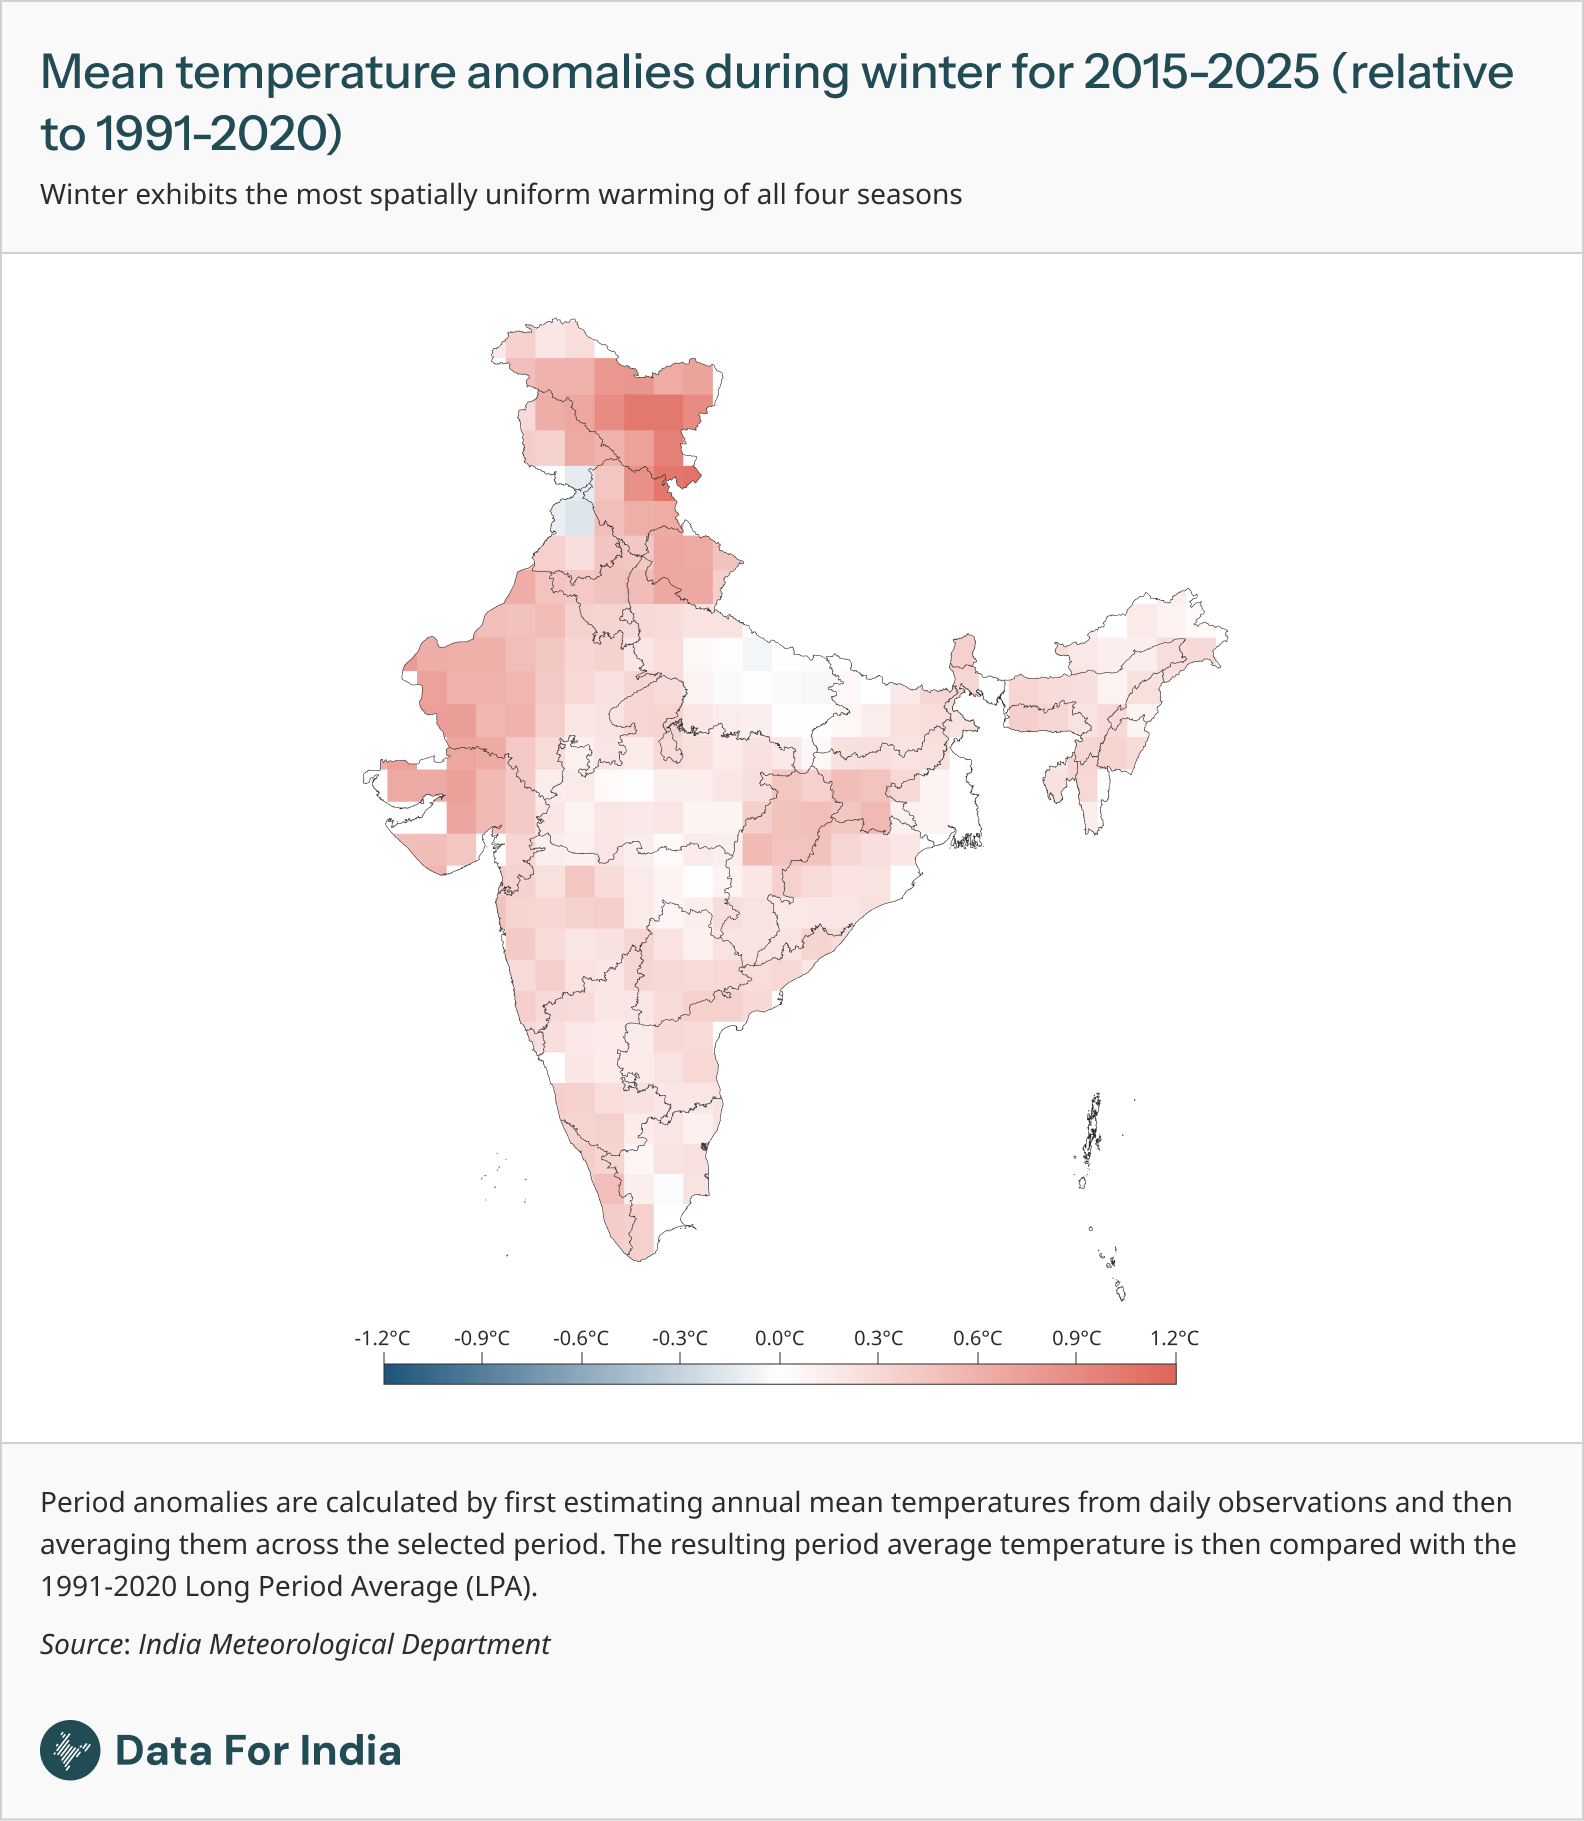
The near-absence of negative anomalies suggests that warmer winters are becoming common across much of India. This has important implications for rabi agriculture, which is particularly sensitive to rising temperatures, while warmer conditions can also increase crop water stress and alter irrigation requirements.[13]
Monsoon: sustained long-term warming
While winter exhibits the most widespread spatial warming, the monsoon season shows the clearest evidence of sustained long-term warming. Mean monsoon temperatures have increased consistently over the past seven decades, with the trend being statistically significant across the 1951-2025 period. This indicates that warming during the monsoon is not simply the result of a few unusually hot years but reflects a shift towards warmer conditions.
The principal warming hotspot shifts eastwards, with eastern Bihar, northern West Bengal and Sikkim recording anomalies between +0.7°C and +0.9°C. These values are among the highest observed across all seasons, indicating that temperatures during the monsoon have risen significantly above the recent climatological average.
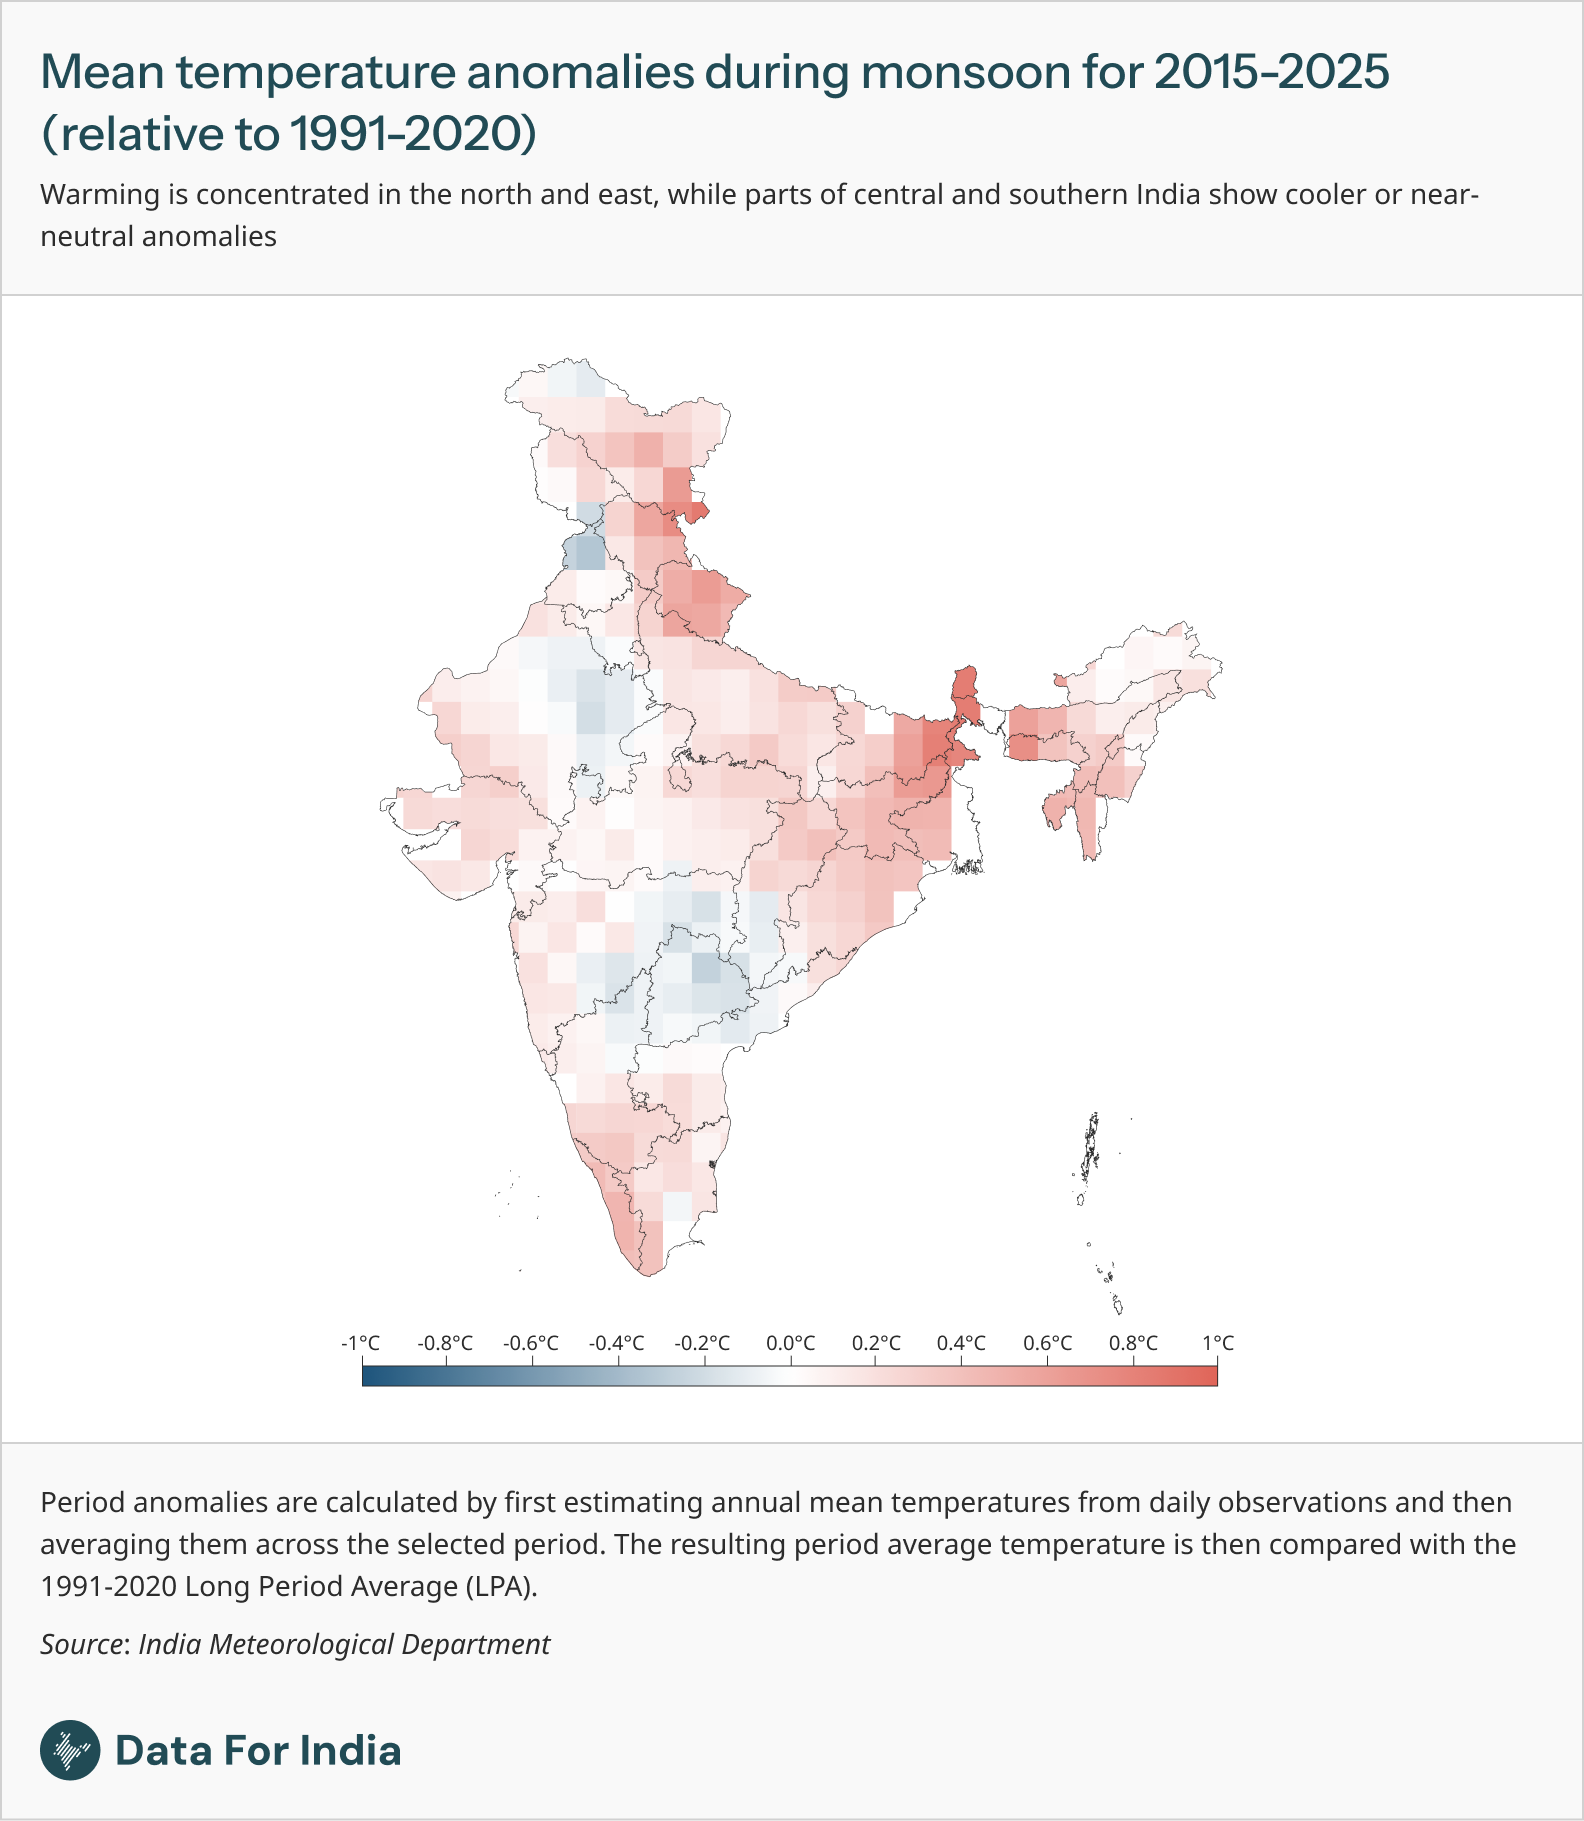
The western Himalayan region and southern peninsula show lesser warming during the monsoon season, with most areas showing neutral to weakly positive anomalies ranging from 0°C to +0.2°C. Isolated pockets of southern Chhattisgarh and Andhra Pradesh show weak negative anomalies of approximately -0.1°C to -0.2°C.
Post-monsoon: warming expands across northern and eastern India
The warming pattern established during the monsoon persists into the post-monsoon season while becoming more geographically extensive.
The post-monsoon season reveals spatially differentiated warming patterns across India relative to the 1991-2020 baseline. Elevated anomalies (+0.4°C to +0.8°C) extend across parts of West Bengal, Bihar, Jharkhand and Odisha. Eastern India continues to record some of the country's highest temperature anomalies with the highest anomalies reaching +0.8°C to +0.9°C in parts of eastern Bihar, northern West Bengal and Sikkim. Warming becomes increasingly pronounced across the western Himalayan region including Himachal Pradesh, Uttarakhand and Jammu and Kashmir, where anomalies approach +0.9°C in several locations. This pronounced warming in the hills and hill stations is significant, as it indicates that traditionally cooler mountain environments are experiencing some of the strongest temperature increases. In the south, localised pockets across Tamil Nadu, Kerala and southern Karnataka exhibit intensified anomalies ranging between +0.4°C to +0.6°C, indicating that warmer conditions now extend across much of the country.
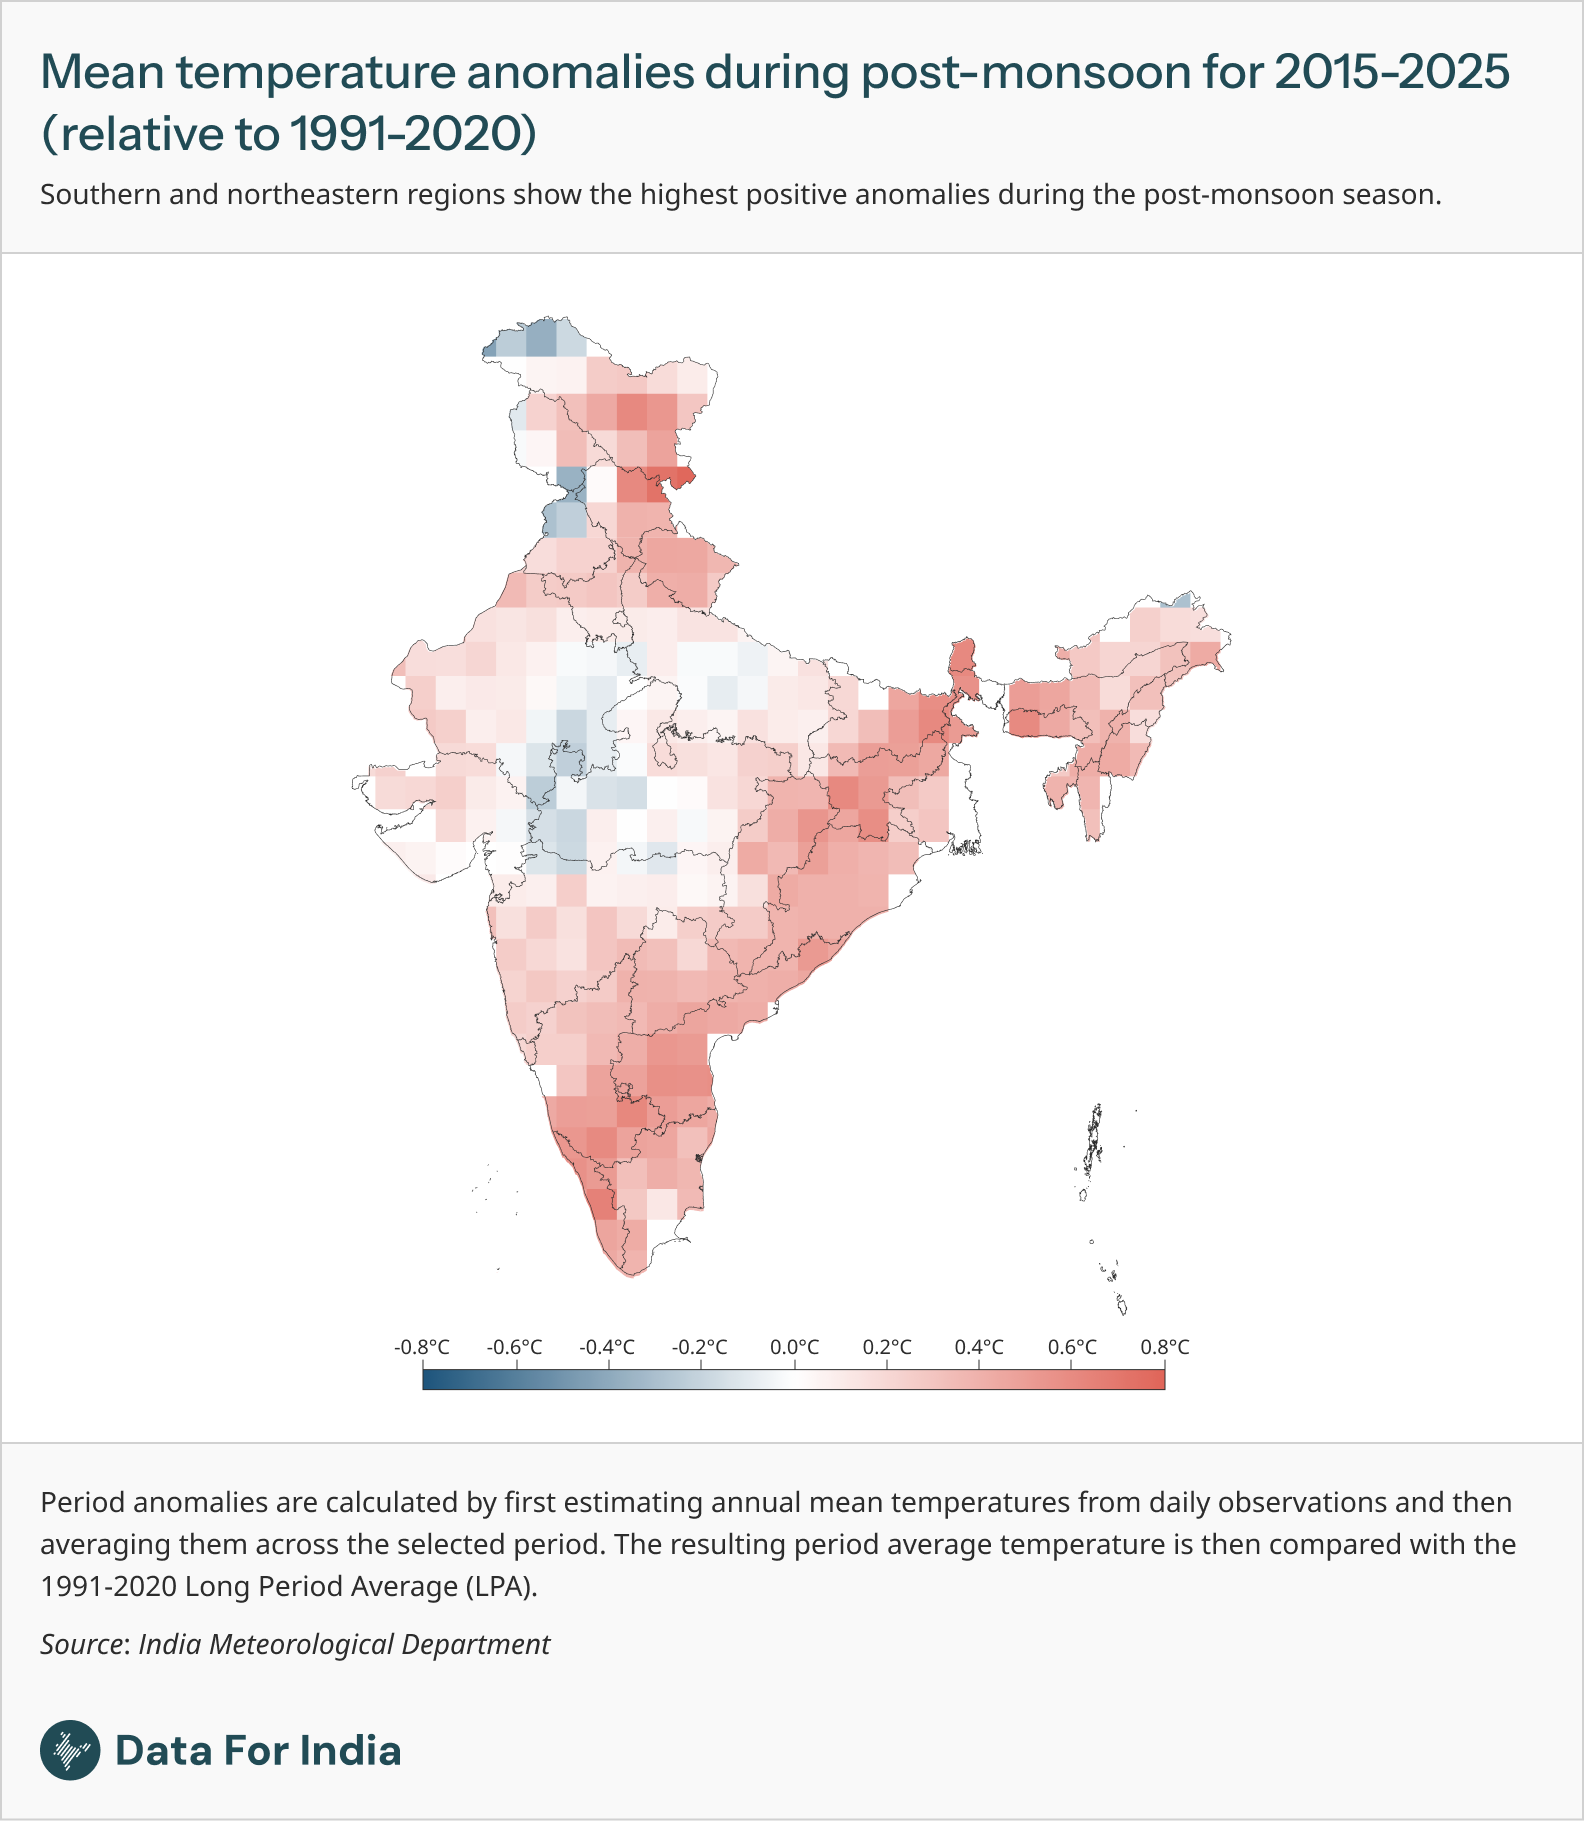
This widespread warming during the post-monsoon months suggests that elevated temperatures are increasingly observed beyond the southwest monsoon, delaying seasonal cooling across large parts of India.
Pre-monsoon: warming remains uneven
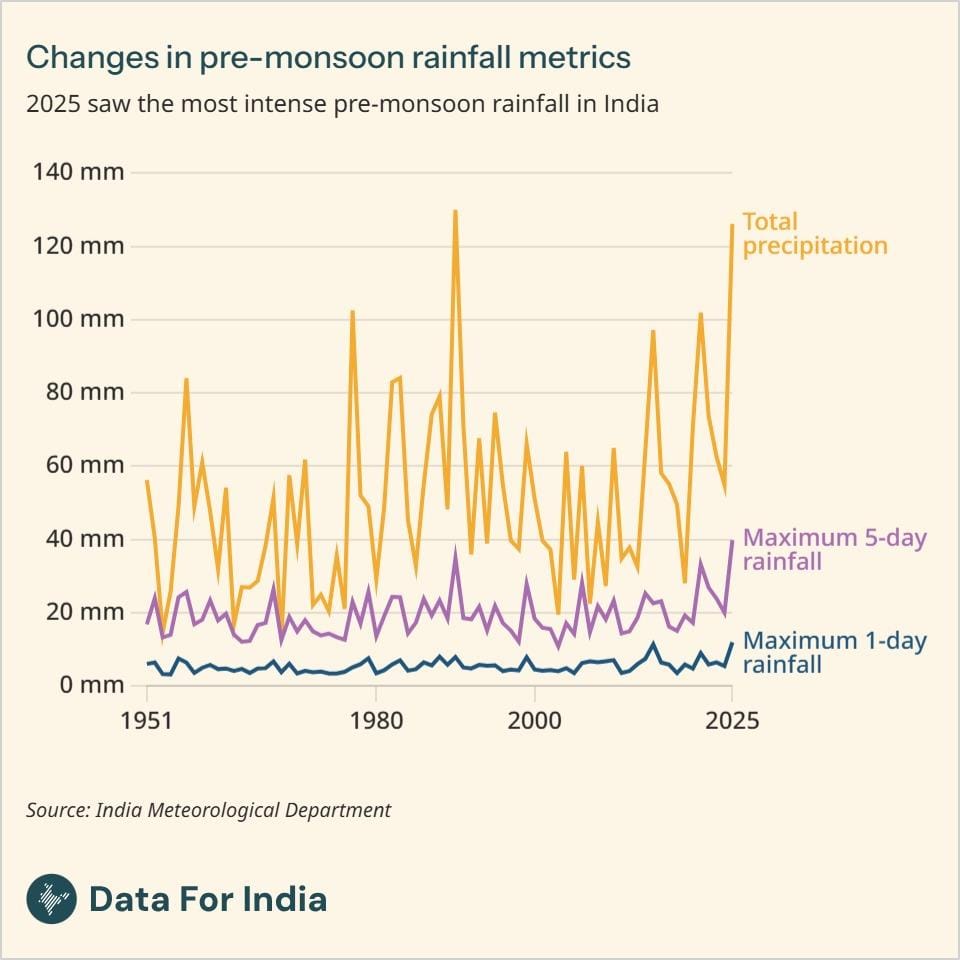
Unlike the monsoon and winter, the pre-monsoon season, or the traditional summer months, shows the greatest regional variation in warming.
The highest positive anomalies are concentrated across western India, particularly Gujarat and western Rajasthan, where anomalies exceed +0.5°C and approach +0.8°C. Parts of Punjab, Haryana, Jammu and Kashmir, Ladakh and northern Rajasthan also show notable warming, with anomalies generally between +0.3°C and +0.6°C. These regions stand out as pre-monsoon warming hotspots, reflecting increased heat accumulation before the monsoon season.
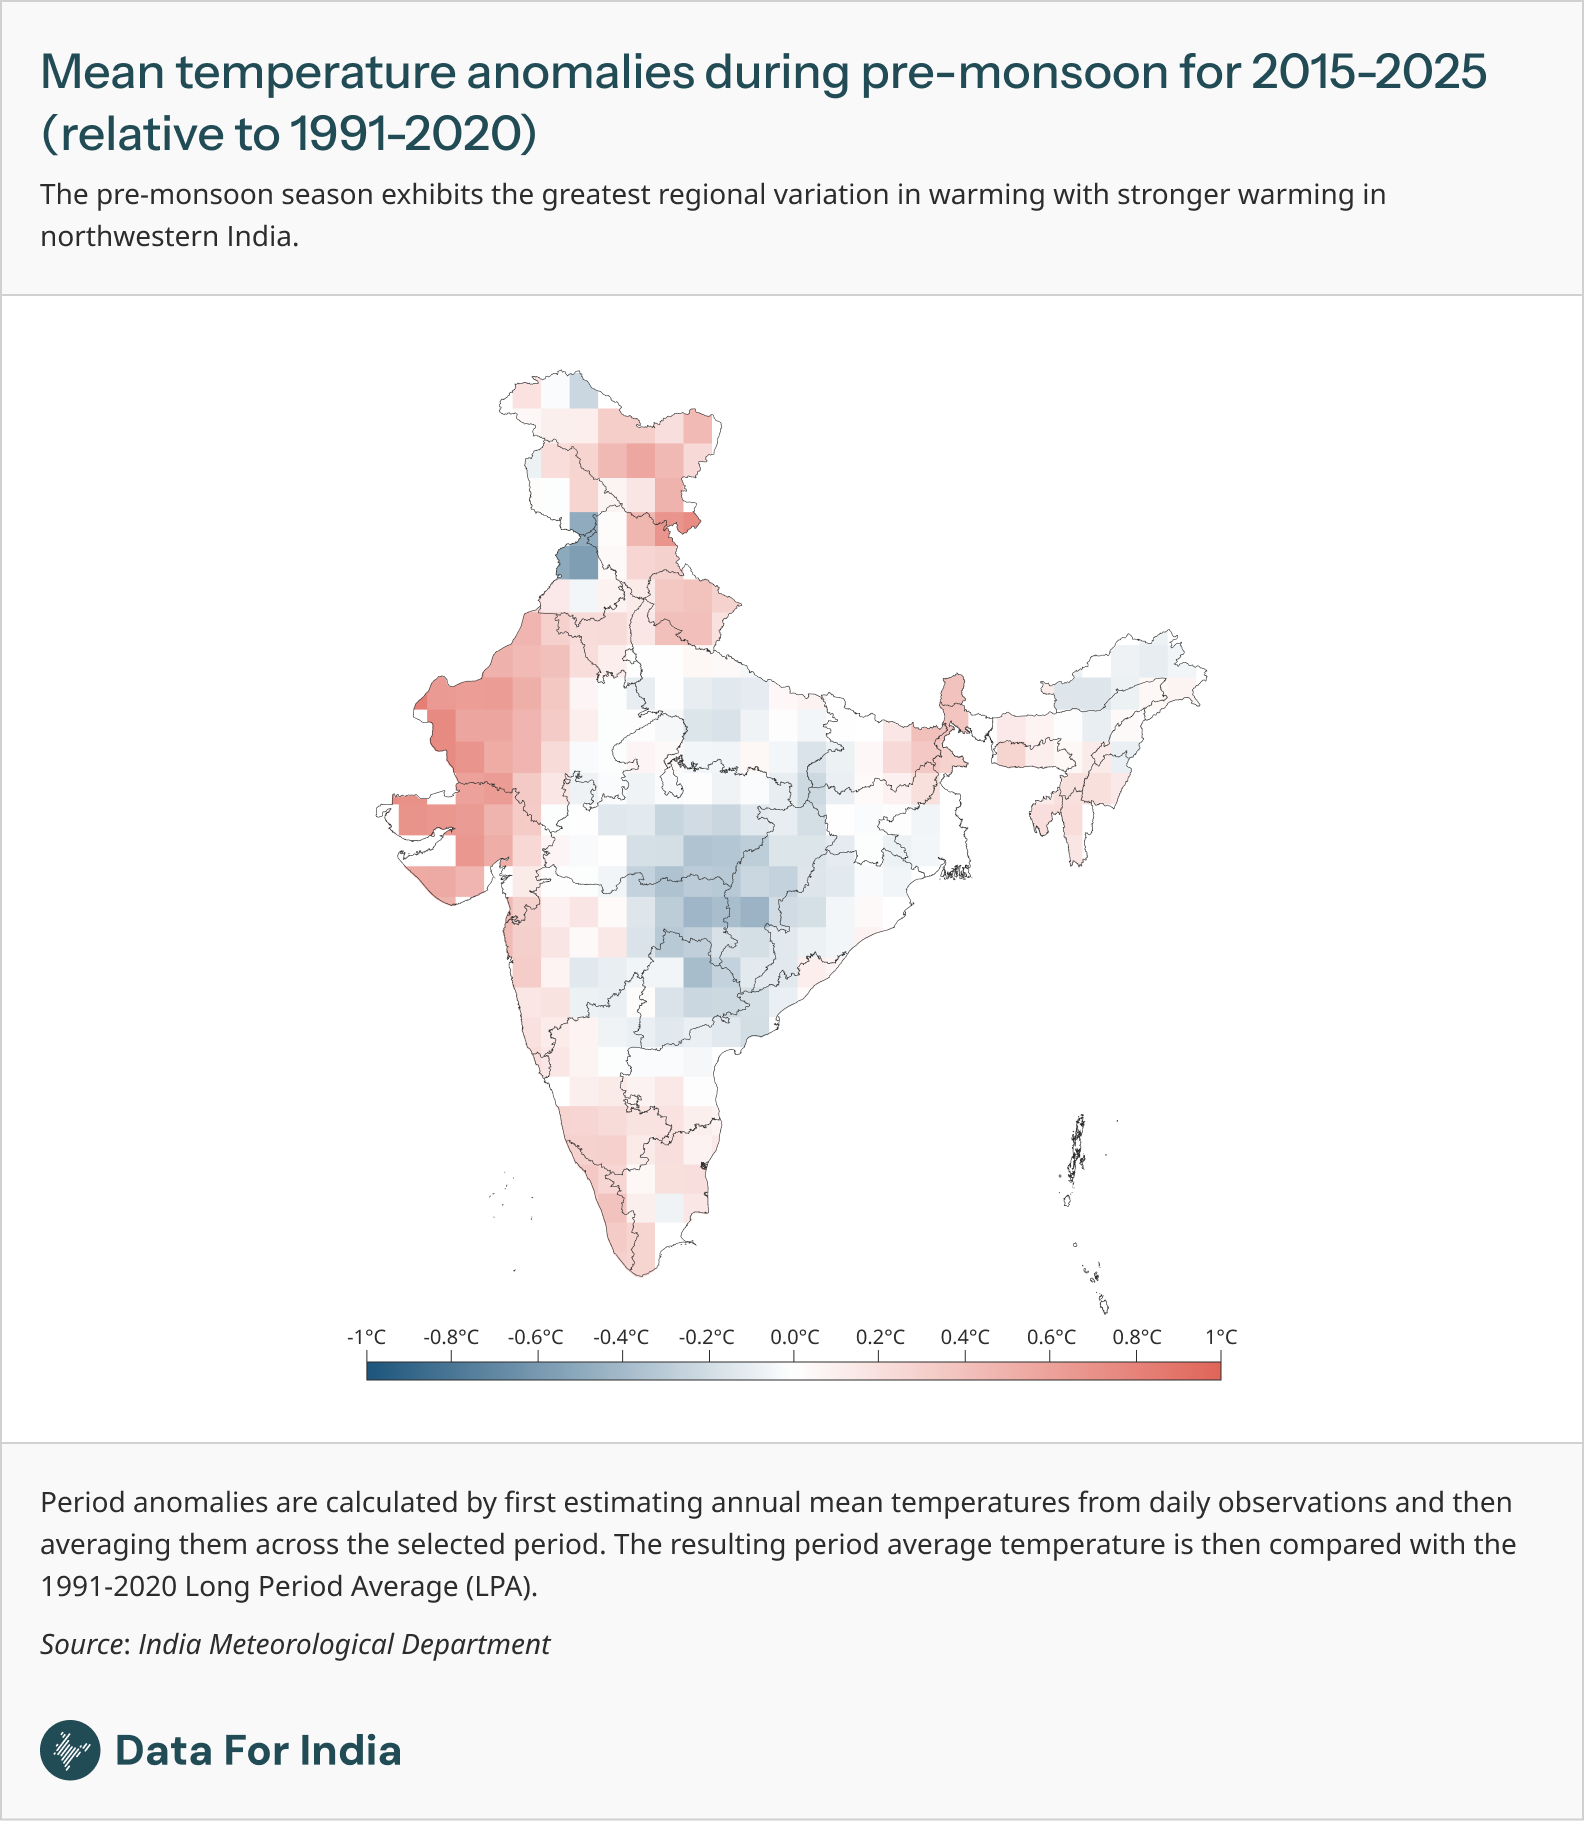
The pre-monsoon season also shows areas with weak warming or cooling relative to the baseline. Parts of Madhya Pradesh, Chhattisgarh, Telangana, Odisha, northern Andhra Pradesh and northern Karnataka show negative anomalies with some localised areas reaching approximately -0.4°C to -0.6°C. This sharp contrast between warming hotspots and cooler pockets makes the pre-monsoon season the most spatially heterogeneous of the four seasons.
Looking beyond annual averages
Annual averages capture the overall direction of warming, but they conceal important regional and seasonal differences. Seasonal analysis reveals where warming is occurring, when it is most pronounced, and which regions are becoming increasingly exposed to climate risks. As climate risks increasingly intersect with agriculture, labour productivity, health and water resources, understanding seasonal warming patterns across states will become essential for designing strategies for adaptation that are tailored to regional and sectoral realities.
[1] Assessment of Climate Change over the Indian Region (2020), India Meteorological Department, Ministry of Earth Sciences, Government of India / Springer.
[2] On the Emergence of Human Influence on Surface Air Temperature Changes Over India (2021), Dileepkumar et al., Journal of Geophysical Research: Atmospheres / American Geophysical Union.
[3] Climate Change 2021: The Physical Science Basis (2021), Intergovernmental Panel on Climate Change, Contribution of Working Group I to the Sixth Assessment Report / Cambridge University Press.
[4] India's surface air temperature data is sourced from the India Meteorological Department's (IMD) national observation network comprising over 500 manual observatories and more than 1000 Automatic Weather Stations (AWS). While advancements in instrumentation and an expanding network of monitoring stations have significantly enhanced data accuracy, long-term climate analyses rely on quality-controlled subsets of several hundred stations with continuous records. For long‑term climate analysis, the IMD uses a homogenised subset of approximately 700 stations with continuous records. Each station records daily maximum and minimum temperatures, contributing roughly 1,460 data points per station annually. This translates to over 500,000 station‑level observations per year that form the basis of the gridded dataset.
[5] Development of a high resolution daily gridded temperature data set (1969-2005) for the Indian region, (2009). Srivastava et. al, India Meteorological Department.
[6] Meteorological Glossary (n.d.), India Meteorological Department, Climate Research and Services, Ministry of Earth Sciences, Government of India.
[7] WMO Guidelines on the Calculation of Climate Normals (WMO-No. 1203), (2017). World Meteorological Organization (WMO).
[8] The choice of baseline affects the magnitude of anomalies or the difference from the long-term average. So, a warmer baseline may yield smaller recent anomalies, while an older, cooler baseline produces larger positive anomalies for the same years.
[9] Historically, different 30-year periods have been used as baselines for analysing temperature change including the periods of 1951-1980 and 1981-2010. Following a global update led by WMO and national meteorological services, the 1991-2020 period has now been adopted as the most recent global climatological normal and is the current standard for operational reporting by many countries including India.
[10] These maps were generated using gridded annual temperature anomaly data from the India Meteorological Department (IMD). The IMD divides India's land surface into a grid of 1° x 1° cells (approximately 111km by 111km), with each cell containing daily records for maximum, minimum, and mean temperatures. Temperature anomalies for each grid cell were calculated relative to the 1991-2020 baseline and then mapped. Current state boundaries were overlaid on the gridded data to improve spatial interpretation and facilitate comparison of regional warming patterns across states.
[11] Decadal mean temperature anomalies were calculated by first estimating the annual mean temperature for each year from daily temperature values. The annual means were then averaged for 2015-2025 and then compared against the Long Period Average (LPA) of 1991-2020. Positive anomalies indicate decades that were warmer than the baseline average, while negative anomalies indicate cooler-than-baseline conditions.
[12] IMD and other meteorological services compute temperature anomalies by subtracting the mean temperature for a chosen baseline period from observed temperatures for the same month or year. Positive temperature anomalies indicate that observed temperatures are higher than the long-term average (baseline) for that period, while negative anomalies indicate temperatures below the historical baseline.
[13] Temperature and precipitation are adversely affecting wheat yield in India (2022), Madhukar et al., Journal of Water and Climate Change.