Welcome back to The Roundup, Data For India’s monthly newsletter bringing you our latest work, new features and major updates, right in your inbox.
In this month’s edition: a clearer look at how India measures GDP, new work on graduates, and Data For India’s work in an NCERT textbook.
The Spotlight
How India’s GDP adds up
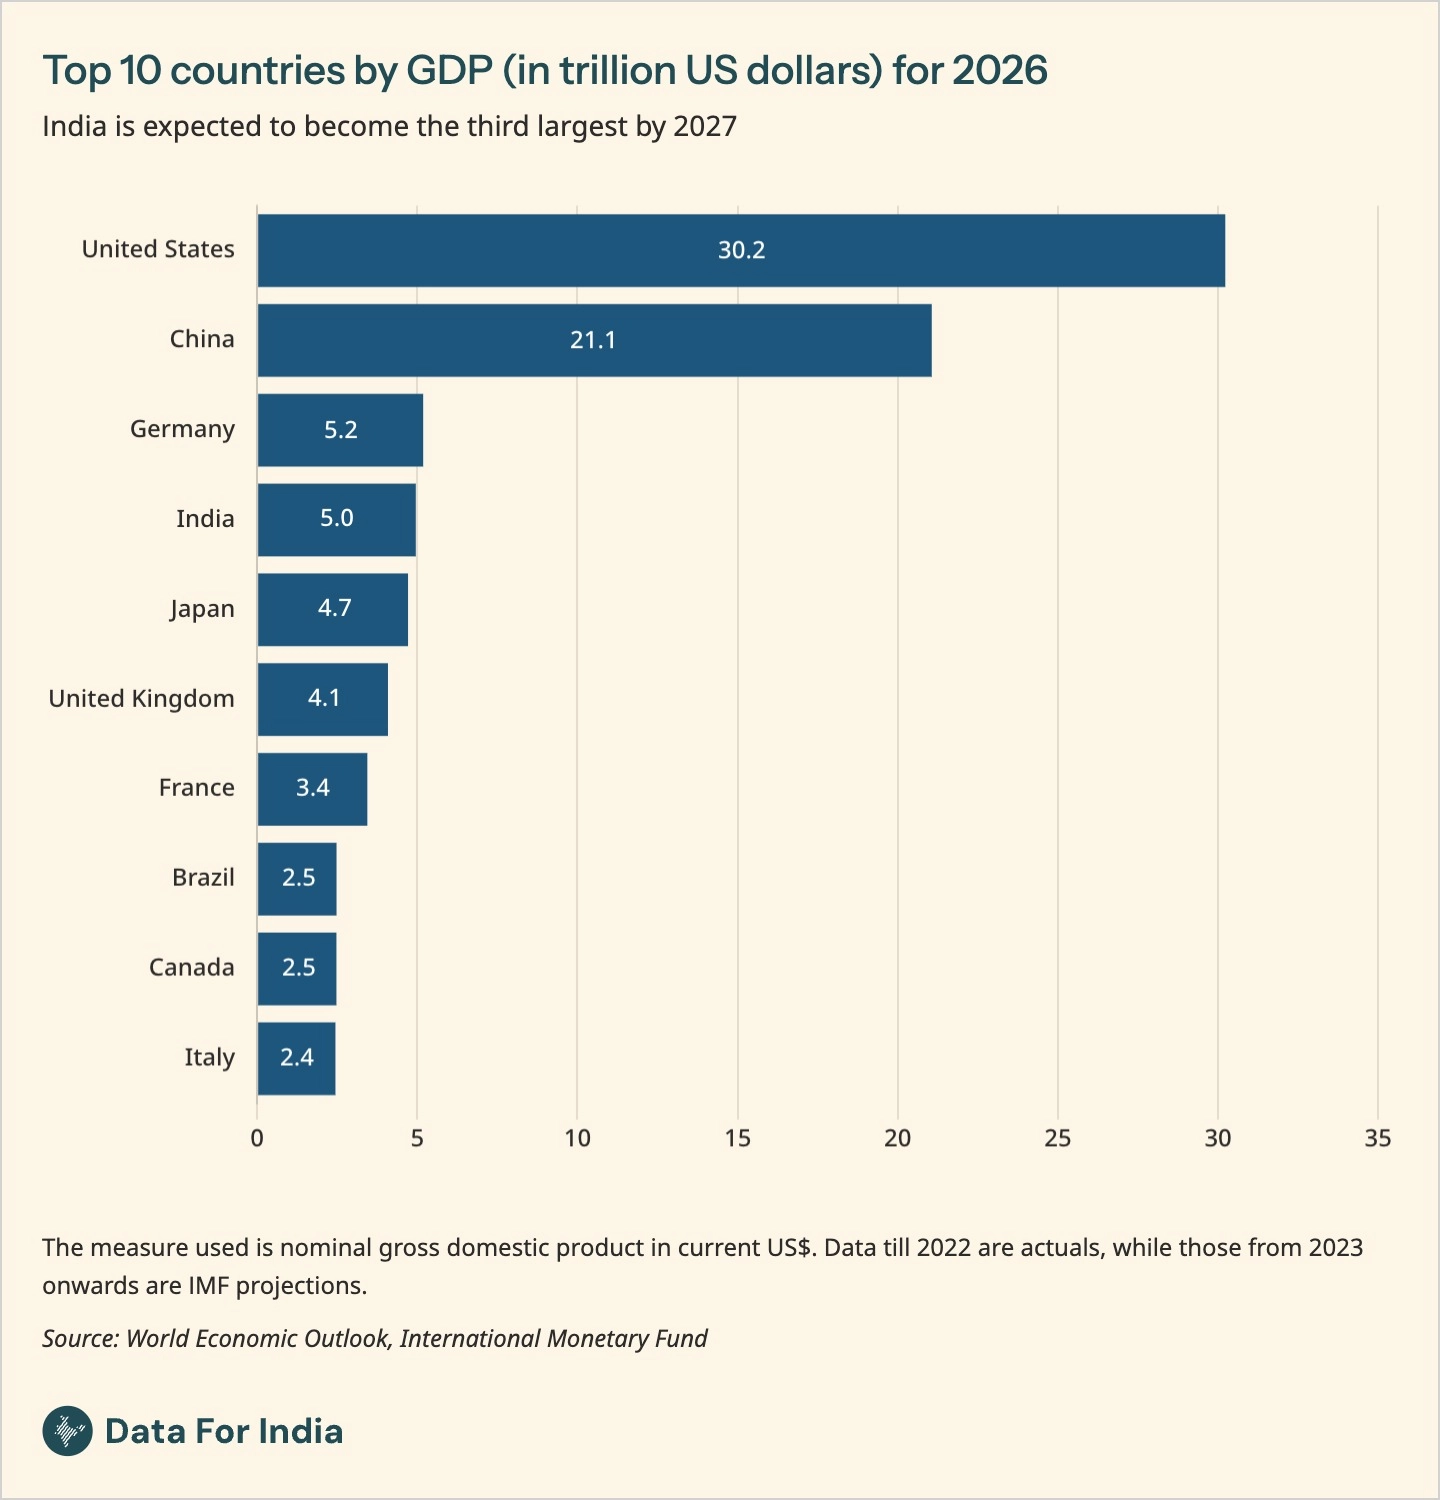
In February this year, the Ministry of Statistics and Programme Implementation (MoSPI) revised the Gross Domestic Product (GDP) base year from 2011-12 to 2022-23 to better reflect how India’s economy has changed. The revision matters because a base year is the measuring rod for GDP. Changing it means updating the data sources, methods, and price adjustments used to estimate the economy.
In his latest measurement piece, our Head of Research, Pramit Bhattacharya, explains how India’s GDP adds up, and what has changed. The piece shows how revisions in the methodology for estimating the GDP changes the way India’s economy is sized, and why the new estimates lowered GDP for 2022-23 by about 3%.
Read it alongside Abhishek Waghmare’s broader analysis of India’s GDP and per capita income and the economies of Indian states. Together, these pieces give a fuller view of India’s economy: how it is measured nationally, and how sharply it varies across states.
New On The Platform
Higher education is often seen as a pathway to better jobs, higher wages, and wider opportunities. In his latest piece, Graduates in India, Abhishek Waghmare looks at how many graduates India has, what they study, and how India compares with other countries.
One in ten Indians is now a graduate, up from fewer than one in a hundred in the 1970s. But this growth is deeply uneven: nearly 20% of adults are graduates in parts of southern, western and northeastern states, while the share is around 8% in Assam and Bihar.
It builds on Abhishek’s earlier work on higher education, showing how access to college has grown, where it remains uneven, and what a degree means in India’s labour market.
One Thing To Try
Introducing Data Bytes
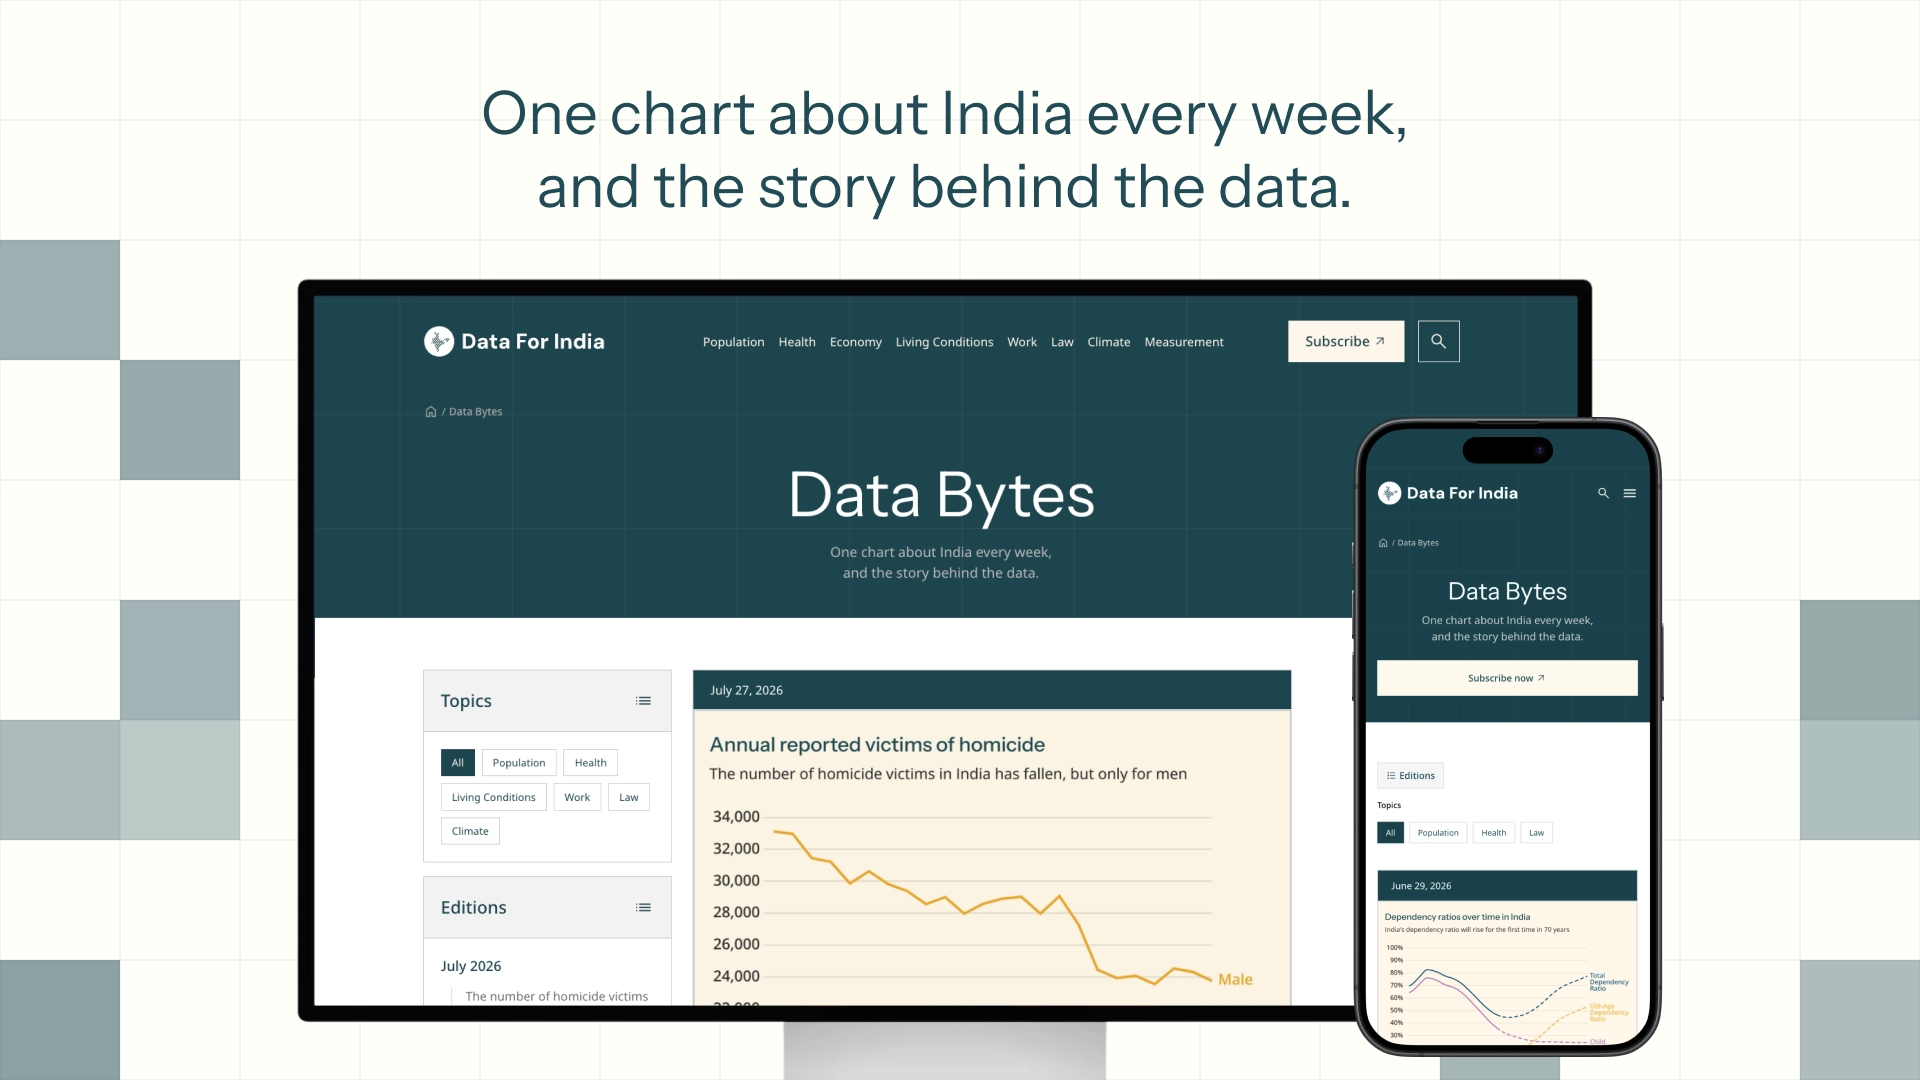
At Data For India, we spend a lot of time on big questions about India: female employment, household spending, fertility, health, the economy, and more. But sometimes, you just want a clear answer to one sharp question.
That is why we launched Data Bytes: one chart about India every week, and the story behind the data.
A month in, Data Bytes already spans topics like court pendency, women’s work, India’s dependency ratio, tobacco use, and how baseline choices affect the way we see warming.
Explore the archive, subscribe for the Monday edition, or share the chart that surprised you.
Conversations We Joined
- Nandlal Mishra, from our research team, gave a talk for Kashf Initiative on Survey Methods in Research: Design and Implementation. The session introduced students and early-career researchers to survey design, sampling, questionnaires, ethics, analysis, and common sources of bias, with examples from NFHS and PLFS.
- Rukmini S joined a roundtable conversation on unlocking public sector data and its value, organised by People+AI and VizChitra in Bengaluru. The discussion focused on how Indian public data is used, communicated, and improved, including the role of organisations that work closely with public datasets and help flag data-quality issues.
Upcoming
- Rukmini S will teach Seeing India Through Data, a course for BA LLB (Honours) students at NALSAR University of Law, Hyderabad, from August 3–6 and September 7–10.
- Rukmini S will also be giving a talk at The Tata Institute of Social Sciences (TISS), Hyderabad, on Data and Statistics for Policy: A Career for Those Who Value Evidence-Based Work, on August 5 from 9-11 am.
Where Our Work Travelled
- NCERT used a chart from our access to electricity piece in their new Ganita Prakash Class 8 mathematics textbook, bringing Data For India into school learning material.
- Mint used our piece on India’s factories to ground its reporting on India’s factory boom and worker shortage.
- The Wire republished our piece on meat consumption in India, carrying our reporting on India’s rising meat consumption and spreading it to a wider audience.
- Bloomberg cited the unemployment data from our piece on India’s graduates in its coverage of student protests.
Talking Point
One chart worth sitting with this month, from a Data For India team member.
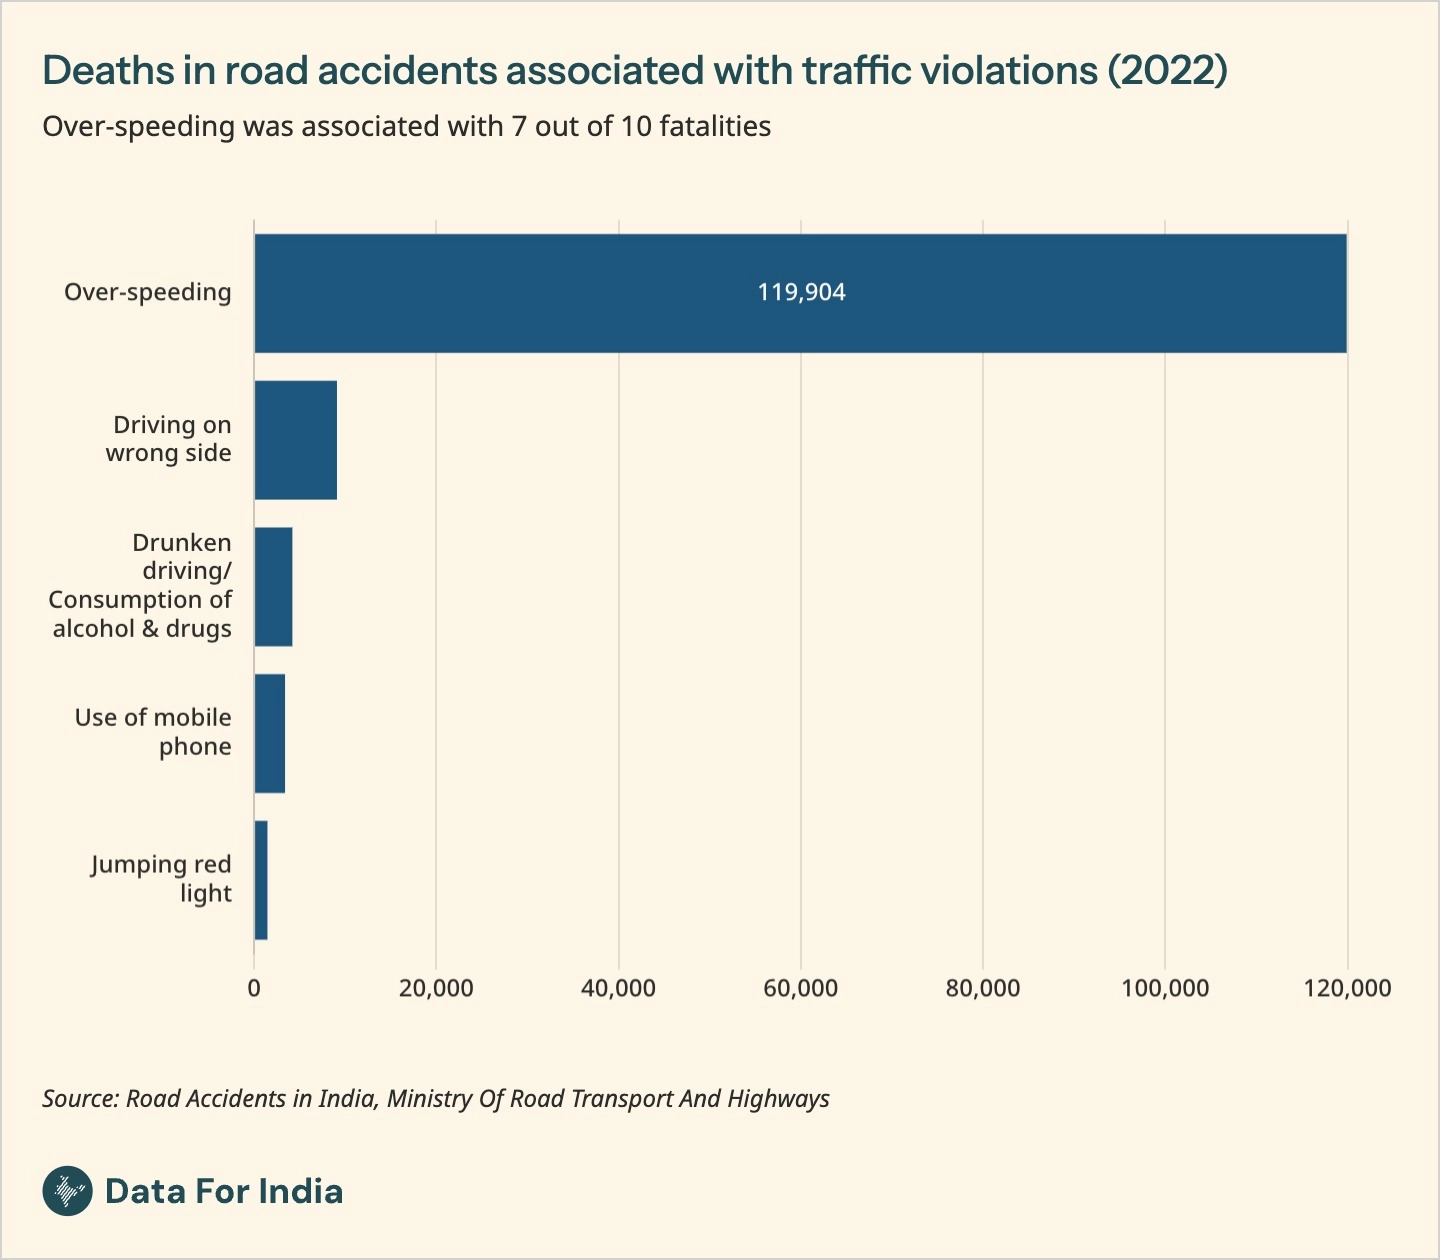
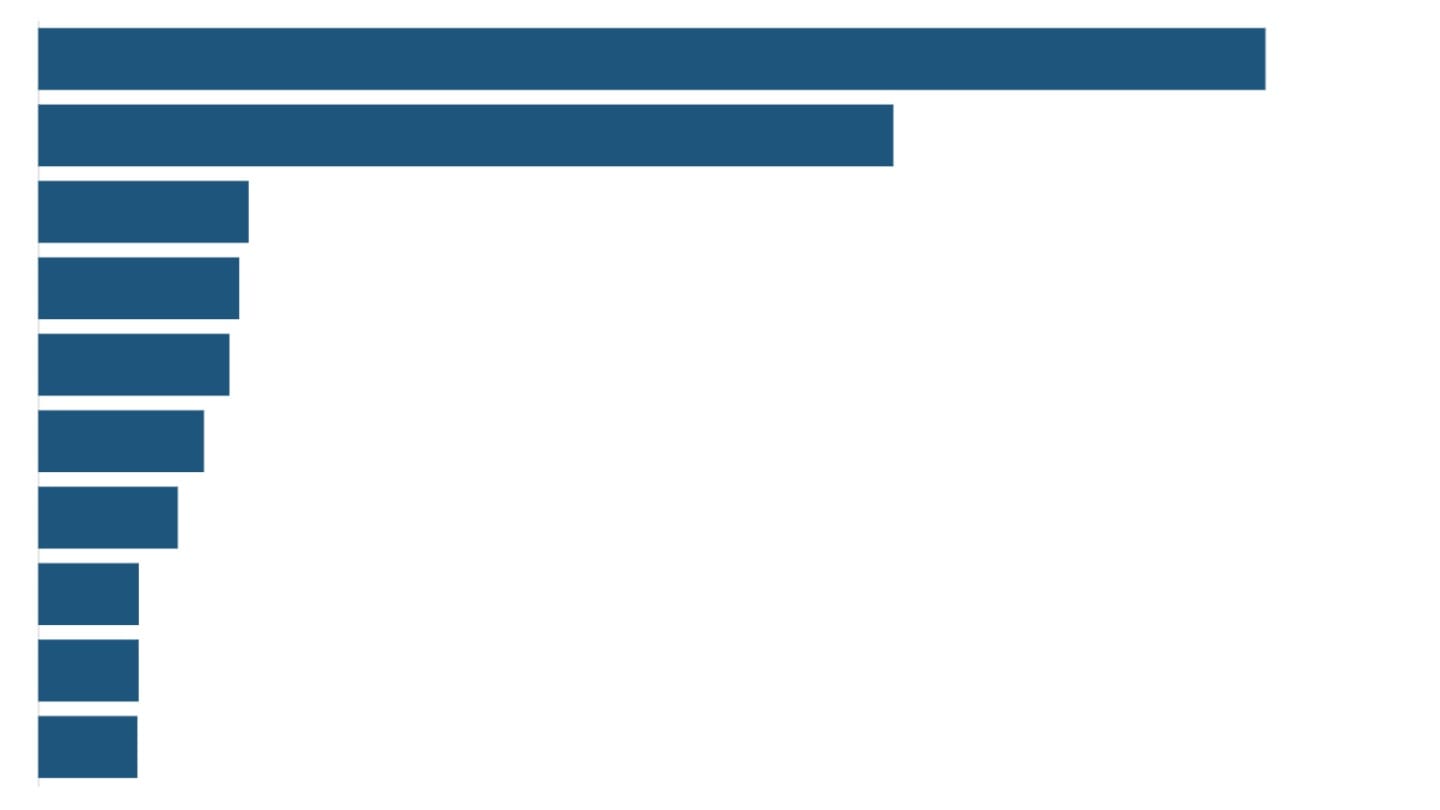
The chart shows that over-speeding is the leading cause of road accident fatalities, but speed is not the only problem. Other common violations, such as driving on the wrong side and jumping red lights, are often overlooked but add a significant number of casualties. Along with the non-use of basic safety gear, non-compliance with traffic rules and speed limits accounts for a large number of preventable deaths.
— Gulshan, Engineer
That’s it for the July 2026 edition of The Roundup. If something you read here shifted how you see India, whether the GDP piece, or a new Data Byte, write to us by replying to this email or reaching out at info@dataforindia.com.
See you again on the last Friday of next month.