Working with statistics can often be a series of compromises, or, to put it a little more positively, a series of decisions. One such decision that is often necessary in the broader scheme of things but can be very unsatisfying at a granular level is the use of averages.
When we talk about inflation, for instance, we know that relying on broad averages is important to understand the big shifts. So we end up looking, for instance, at retail inflation - which is the rate at which the prices of a basket of goods and services has risen over a certain period for the average Indian household. That number, when measured year on year, shows, for example, that retail inflation in the Indian economy used to be much more volatile in past decades, but has averaged 5% or so over the last ten years, as my colleague Abhishek Waghmare found.
What stable averages like these hide, however, are sharp fluctuations in the trajectories of the components that make up that average. In the case of inflation, for example, if we were to look not at a basket of goods but at one item alone, things would look far less stable.
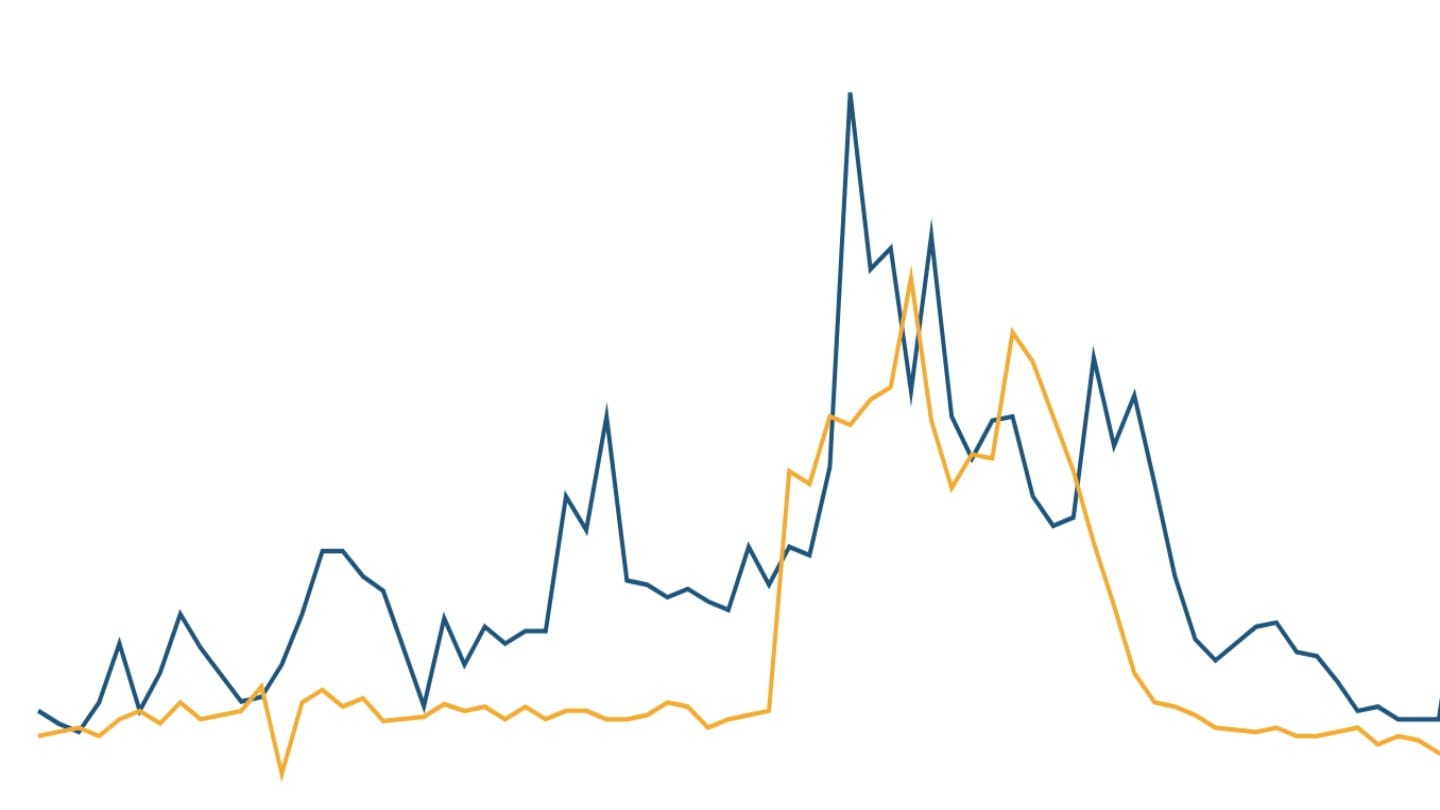
In the second half of 2019, the price of onions more than quadrupled in just five months as a result of unseasonal rains, flooding and crop damage.

In literal terms, this means that Indians on average went from paying Rs 25 per kilogram of onions to Rs 95 per kilogram in the span of just five months in 2019. Here too, averages do not give the full picture, because prices are often highly localised and parts of the country would have been paying more than those averages. That's a feeling, a lived reality, that 5% inflation doesn't really capture.
None of this means that that number was wrong - onion prices did go back down, and a household spends on many more things than onions alone, all of which makes an average a good overall measure.
But at the very least, it's useful to remember that what might look like one stable big shift over time might just be the average of many highly volatile components, each telling a story of a far more jagged lived reality than a smooth line captures.