The World Bank periodically creates global poverty lines and estimates the share of people in different countries who live below these poverty lines. In this piece, we examine recent changes in the Bank's methodology and some of the questions around it.
To construct global poverty lines, the Bank follows three steps:
i) using the median of national poverty lines in an income group to calculate global poverty lines,
ii) generating estimates of household income or consumption distribution for a country using national surveys, and normalising them to a fixed point in time to adjust for inflation using consumer price indexes, and
iii) converting the poverty lines and the income or consumption distributions into a common currency that accounts for differences in price levels using purchasing power parities (PPPs).
The World Bank periodically revises its poverty estimation methodology when new and better data becomes available. In its latest revision (June 2025), the World Bank made changes in all three steps.[1] We examine these changes and the significant impact they have had on poverty estimates for India.
Recent changes and their implications for India
1. The use of a new consumption expenditure survey
The World Bank uses either consumption or income surveys for a country to estimate how much a household would need to spend in order to afford a minimum standard of living, as well as the number of households who are below the poverty line. Household surveys in richer countries generally capture incomes of households. In developing countries, accurately assessing income data is difficult. As a result, India and other developing countries measure consumption expenditure instead, and use it as a proxy for income.
The Bank traditionally used India's Consumer Expenditure Surveys (CES) in estimations of poverty. However after conducting a survey in 2011-12, the Indian government conducted no new household survey for over a decade. In this period, the World Bank used estimates from older CESs for years up to 2011, and the Consumer Pyramid Household Surveys from the Centre for Monitoring Indian Economy between 2012 and 2021 to generate consumption aggregates for Indian households.
India's National Statistics Office conducted a new Household Consumption Expenditure Survey (HCES) between August 2022 and July 2023. The Bank's June 2025 update uses the data from this survey.
The new HCES 2022-23 included a series of methodological changes such as new ways of stratification of the sample and multiple household visits, which has created challenges in using it for comparisons with past consumption expenditure surveys. (Read more about those changes here.)
2. Change in recall periods
One of the biggest changes in the new HCES was in the way reference periods were used. In household surveys on consumption expenditure, enumerators ask respondents about their spending on different items with a "period of recall". For each item, the respondent has to remember, retrace and recall their household expenditure on that item in that specified time period, also called the reference period. The choice of a reference period can affect how much expenditure the respondent is able to recall, and as a result, how rich or poor she appears to be.
In the past, India's consumption surveys used the Uniform Reference Period (URP) for all prior consumption expenditure surveys. The URP uses a unified recall of purchases over the last 30 days for all goods and services. Here, households are asked about their domestic expenditure over the 30 days preceding the survey, for all items, whether milk or clothing or televisions.
National poverty lines were set using consumption aggregates based on the URP method, and the World Bank's poverty estimates also used them.
In the 2009-10 and 2011-12 rounds of the consumption surveys, the NSO experimented with the use of three reference periods, including the Modified Mixed Reference Period (MMRP), to record household data on domestic consumption expenditure for its consumption expenditure survey. In this round, the NSO canvassed two parallel sub-samples, one using the MMRP, and the other using both the URP and the MRP (Mixed Reference Period).
In MRP and MMRP, recall periods for items vary according to their frequency of purchase. The URP used a uniform recall period of 30 days for all items. The MRP used 30 days for most items, and 365 days for a few items on which household spending is rarer than monthly frequency; for instance, clothing and household durables. The MMRP uses the 30 and 365 day recall periods for some items, and, additionally, seven days for some food items that are bought more frequently, like milk and eggs.
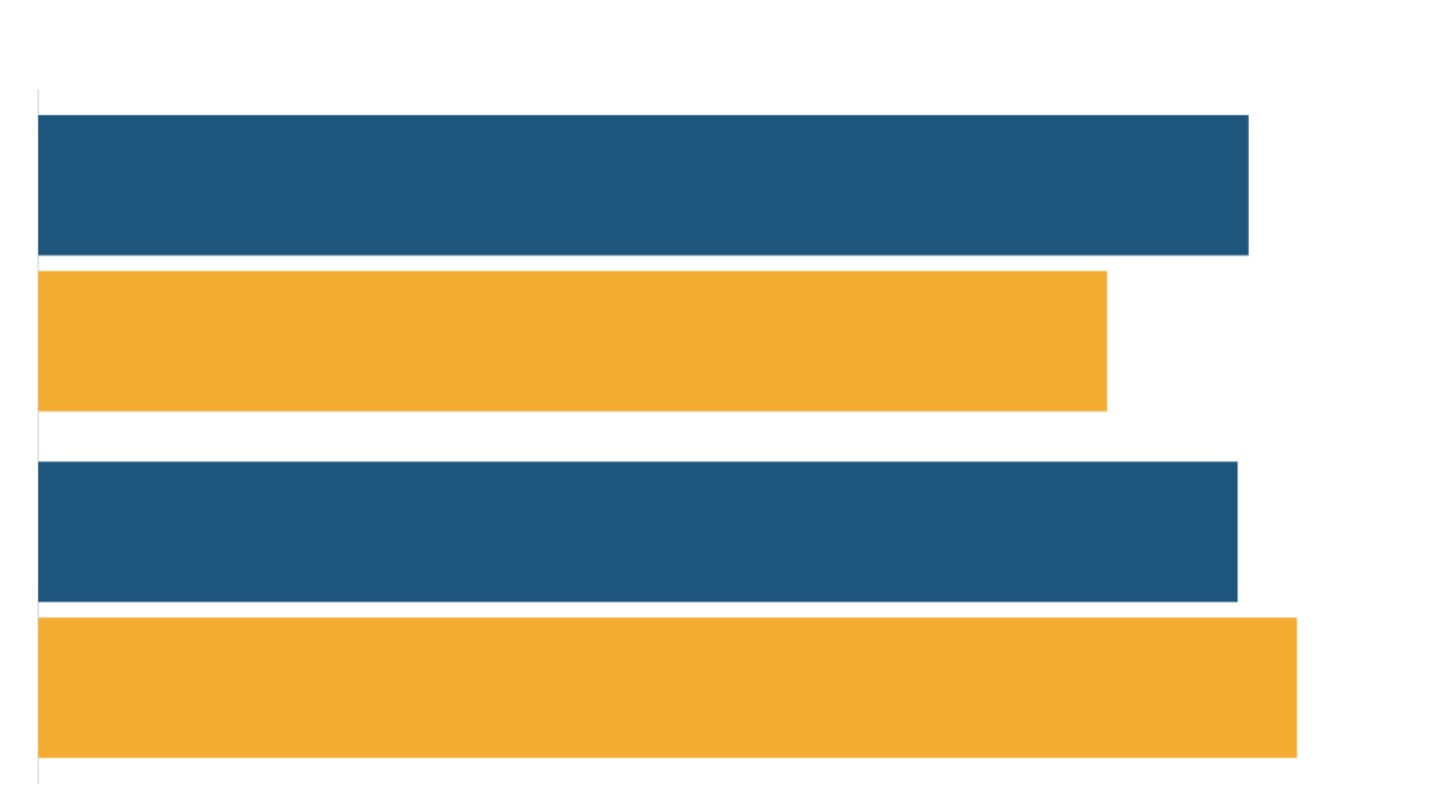
As compared to the URP method, the MRP and MMRP methods led to a higher estimation of household spending in both the rounds, with the use of the MMRP resulting in a much larger increase. A key reason for higher spending as estimated through the MMRP was the higher measured spending on food items, which were canvassed with a seven-day recall in this method. In the URP and MRP methods this recall period was of 30 days. A shorter recall period allowed households to estimate their spending more accurately, and resulted in higher measured consumption expenditure.[2]
Following this experiment, from the 79th round (2022-23), the NSO moved to conducting the Household Consumption Expenditure Survey (HCES) only using the MMRP method.
The new reference period had a significant impact on the overall poverty estimate for India, because it increased the amount of consumption that a household head was able to recall, and as a result, that the survey estimated. This meant that a household would appear richer in the survey than it had with the older method.[3]
In the June 2025 update, the World Bank not only used the MMRP method to generate the distribution of household spending for 2022-23, but also applied the MMRP method to older survey years to make the data comparable over time. For older surveys which were conducted only using the URP method, the Bank converted the original findings by using the MMRP method and conversion factors generated from the CES 2011-12 which recorded consumption expenditure using both the methods.[4]
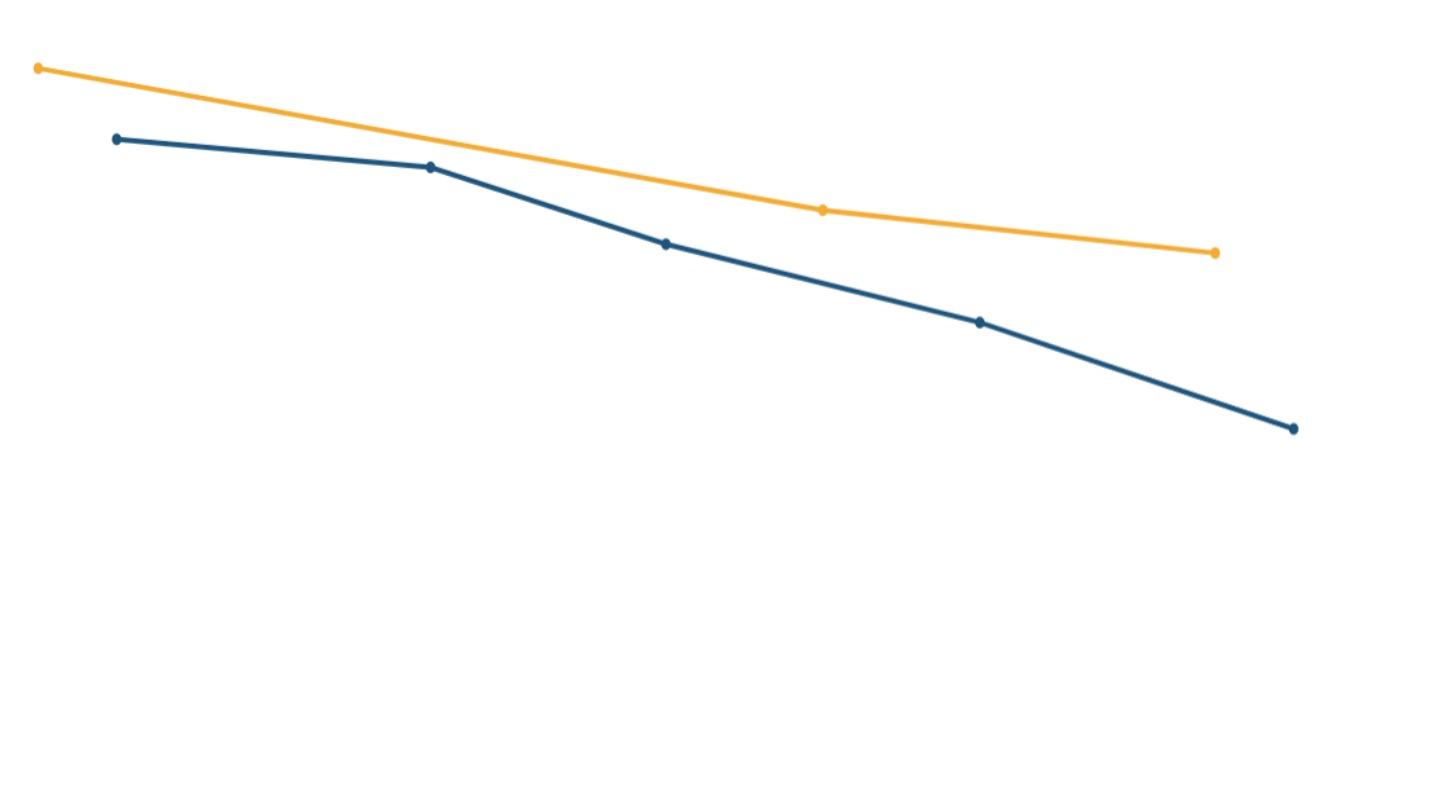
Research by the World Bank shows that the shift from URP to MMRP captures the "measured consumption" of a household to a better degree, and at a higher level in quantitative terms.[5][6] This change in methodology alone reduced the extreme poverty rate in India from 23% to 16% in 2011-12 (using 2017 PPPs).[7]
3. Shift to a welfare aggregate
India's Household Consumption Expenditure Survey (HCES) records data on all domestic consumption of households and is used by the Bank.
But not all household expenditure is welfare-enhancing. For instance, a part of the expenses such as interest payments and medical emergencies reduce the amount that could be spent on household welfare. On the other hand, there are some non-monetary measures such as subsidised food, which do not entail any out-of-pocket expenditure, but are welfare-enhancing.
To generate an accurate picture of household economic well-being that adheres to globally recognised practice, the World Bank modified the basket of goods and services that it used to estimate the minimum needs of households, and created a new concept called the welfare aggregate.
The welfare aggregate included food items and school uniforms received by households at subsidised rates or for free from government agencies at their market prices. It excluded durables, jewellery, house rent and hospitalisation spending. This new consumption aggregate conforms better to best international practices, according to the Bank.
The Bank reasoned that due to the inconsistent and infrequent nature of expenses on consumer durables, it is difficult to derive the welfare they draw from it along the year. Hospitalisation expenses were excluded for not being welfare-enhancing, while jewellery expenses were excluded since they act as stores of value, and not as consumer spending. House rent was excluded from the purview of the welfare aggregate due to difficulties in capturing the value of housing services for renters and homeowners in a uniform manner.[8]
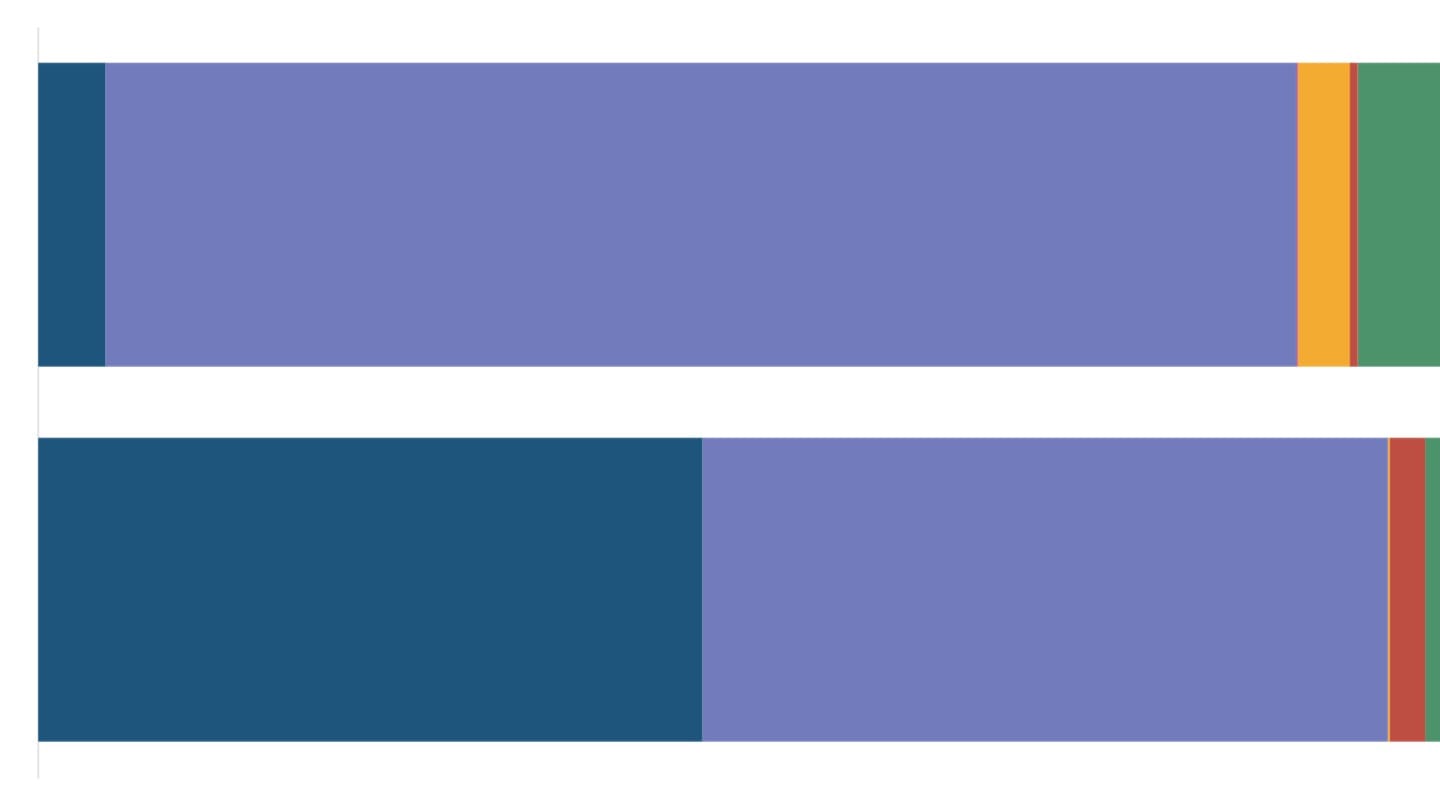
The impact of this change was that it reduced the measured consumption of households, but mostly at the richer end of the income classes, which spend a relatively larger amount on jewellery, durables, etc.[9]
For survey data prior to 2011, the World Bank's new methodology converts the consumption data to the welfare aggregate to the extent possible, but does not include imputed expenses on subsidised items because of limited availability of such data. This means that for years prior to 2011, subsidies, if any, received by households could not be accounted for.
4. Price adjustments
One further adjustment the Bank must make is of prices.
First, prices of consumption items may differ by state and region; the same goods may cost differently in Arunachal Pradesh and Delhi. The Bank wants to account for these price differences in measuring the real value of the welfare aggregate at each location. For this, the Bank uses consumer price indexes at the level of state and region (rural/urban) to deflate consumption as recorded in different places to be comparable.
Secondly, since households are surveyed around the year in consumption surveys, but the Bank would like to compare the cost of the welfare aggregate to all households at the same point in time, it also adjusts the welfare aggregate for the prices prevailing in the month of the survey. These two adjustments together normalise for cost-of-living differences across location and time.
Both these adjustments are done using the PPP year as the base year, since that is the year for which the PPP conversion rates are available.
In its June 2025 update, the Bank replaced the old consumer price indices it was using with new indices from the Reserve Bank of India. The use of the new indices further impacted the perceived fall in poverty as a result of the inclusion of better, more updated data.
Implications for changes in poverty in India over time
India has not produced its own poverty estimates for over a decade, in part as a result of the long gap between its 2011-12 and 2022-23 household consumption expenditure surveys, and the absence of a recent national poverty line. As a result, poverty estimates from the World Bank became an important potential source of data.
However, the Bank's June 2025 update made a series of methodological changes mentioned in this piece, and made statistical adjustments to past data to be able to make comparisons over time. Sampling and surveying changes in a new consumption survey affected how much consumption was being captured. The use of new reference periods increased captured consumption. A new definition of a minimum basket of goods and services redefined what poverty meant. New consumer price indices affected the apparent scale of the fall in poverty. All of these changes were then applied using statistical measures for past years.
What this suggests is that using the new method to create time series that include past years could produce comparable data, but comparing poverty estimates at different points in time using the old methods for past years and the new method for current estimates would produce a misleading picture. Whether estimates of poverty reduction over time using these new methodologies and adjustments are robust is also a matter of debate among economists.[10]
[1] "June 2025 Update to the Poverty and Inequality Platform (PIP)" (2025), Federica Alfani, Danielle V. Aron et. al., World Bank Group.
[2] The 68th round of the National Sample Survey estimated the Monthly Per capita Consumption Expenditure (MPCE) as captured using the MMRP method to be 12% higher in rural areas and 10% higher in urban areas on average, compared to the estimates obtained using the URP method. The corresponding increases using the MRP approach were 1% higher measured consumption in rural areas, and 3% higher in urban areas. "Key Indicators of Household Consumer Expenditure in India (July 2011-June 2012)", June 2013, Ministry of Statistics and Programme Implementation.
[3] "India: Trends in Poverty, 2011-12 to 2022-23, Methodology Note" (2025), World Bank Group.
[4] The conversion of older estimates using URP into MMRP-based estimates is done using adjustment factors. Apart from the absence of older MMRP estimates, spatial data on prices is also not available for older years, which makes the consumption aggregates and their normalisation to a fixed point in time more uncertain. For a critique of the time series under the new methodology, see "The Great Indian Poverty Debate" (2025), Gaurav Datt, The India Forum.
[5] "India: Trends in Poverty, 2011-12 to 2022-23, Methodology Note" (2025), World Bank Group.
[6] "Global Poverty Revisited Using 2021 PPPs and New Data on Consumption" (2025), Elizabeth Foster, Dean Jolliffe et. al., World Bank Group.
[7] "Global Poverty Revisited Using 2021 PPPs and New Data on Consumption" (2025), Elizabeth Foster, Dean Jolliffe, Gabriel Lara Ibarra, Christoph Lakner, Samuel Tetteh-Baah, World Bank Group.
[8] "June 2025 Update to the Poverty and Inequality Platform (PIP)" (2025), Federica Alfani, Danielle V. Aron et. al., World Bank Group.
[9] "India: Trends in Poverty, 2011-12 to 2022-23, Methodology Note" (2025), World Bank Group.
[10] "What Lies Behind the World Bank's Estimates of Low Poverty and Inequality in India?" (2025), Himanshu, The India Forum.