Of all the big shifts that India has undergone, the decline in poverty is the most fundamental - everything else becomes moot, really, if poverty is at high levels, and most other developments go hand in hand with a decline in poverty. For something so fundamental, you'd imagine that the data is pretty straightforward. That, unfortunately, is very much not the case.
Nationally, poverty in India is measured by calculating household consumption levels, and applying a poverty line to that data to see how many people fall below that line. The first part faced an interruption with no household consumption survey conducted between 2011-12 and 2022-23, but now appears to be back on track. The second part is more complicated and requires a country to define a poverty line; India last announced a poverty line in 2014. This leaves us with no recent, or consistent, national estimates.
The World Bank produces poverty lines and poverty estimates for countries of the world. For his work on poverty, my colleague Abhishek Waghmare read through years of World Bank documentation to understand how they defined and measured poverty in the past, and in their latest estimates released in June 2025.
There are a number of things at play here, and I encourage you to read the whole piece of work. The overarching story is clearly that poverty has declined significantly in India, especially since the early 2000s. Plenty of ink has been shed in Indian newspapers about which period precisely poverty fell the fastest in. But for me, what these numbers throw up is something almost philosophical: how do we want to see ourselves?
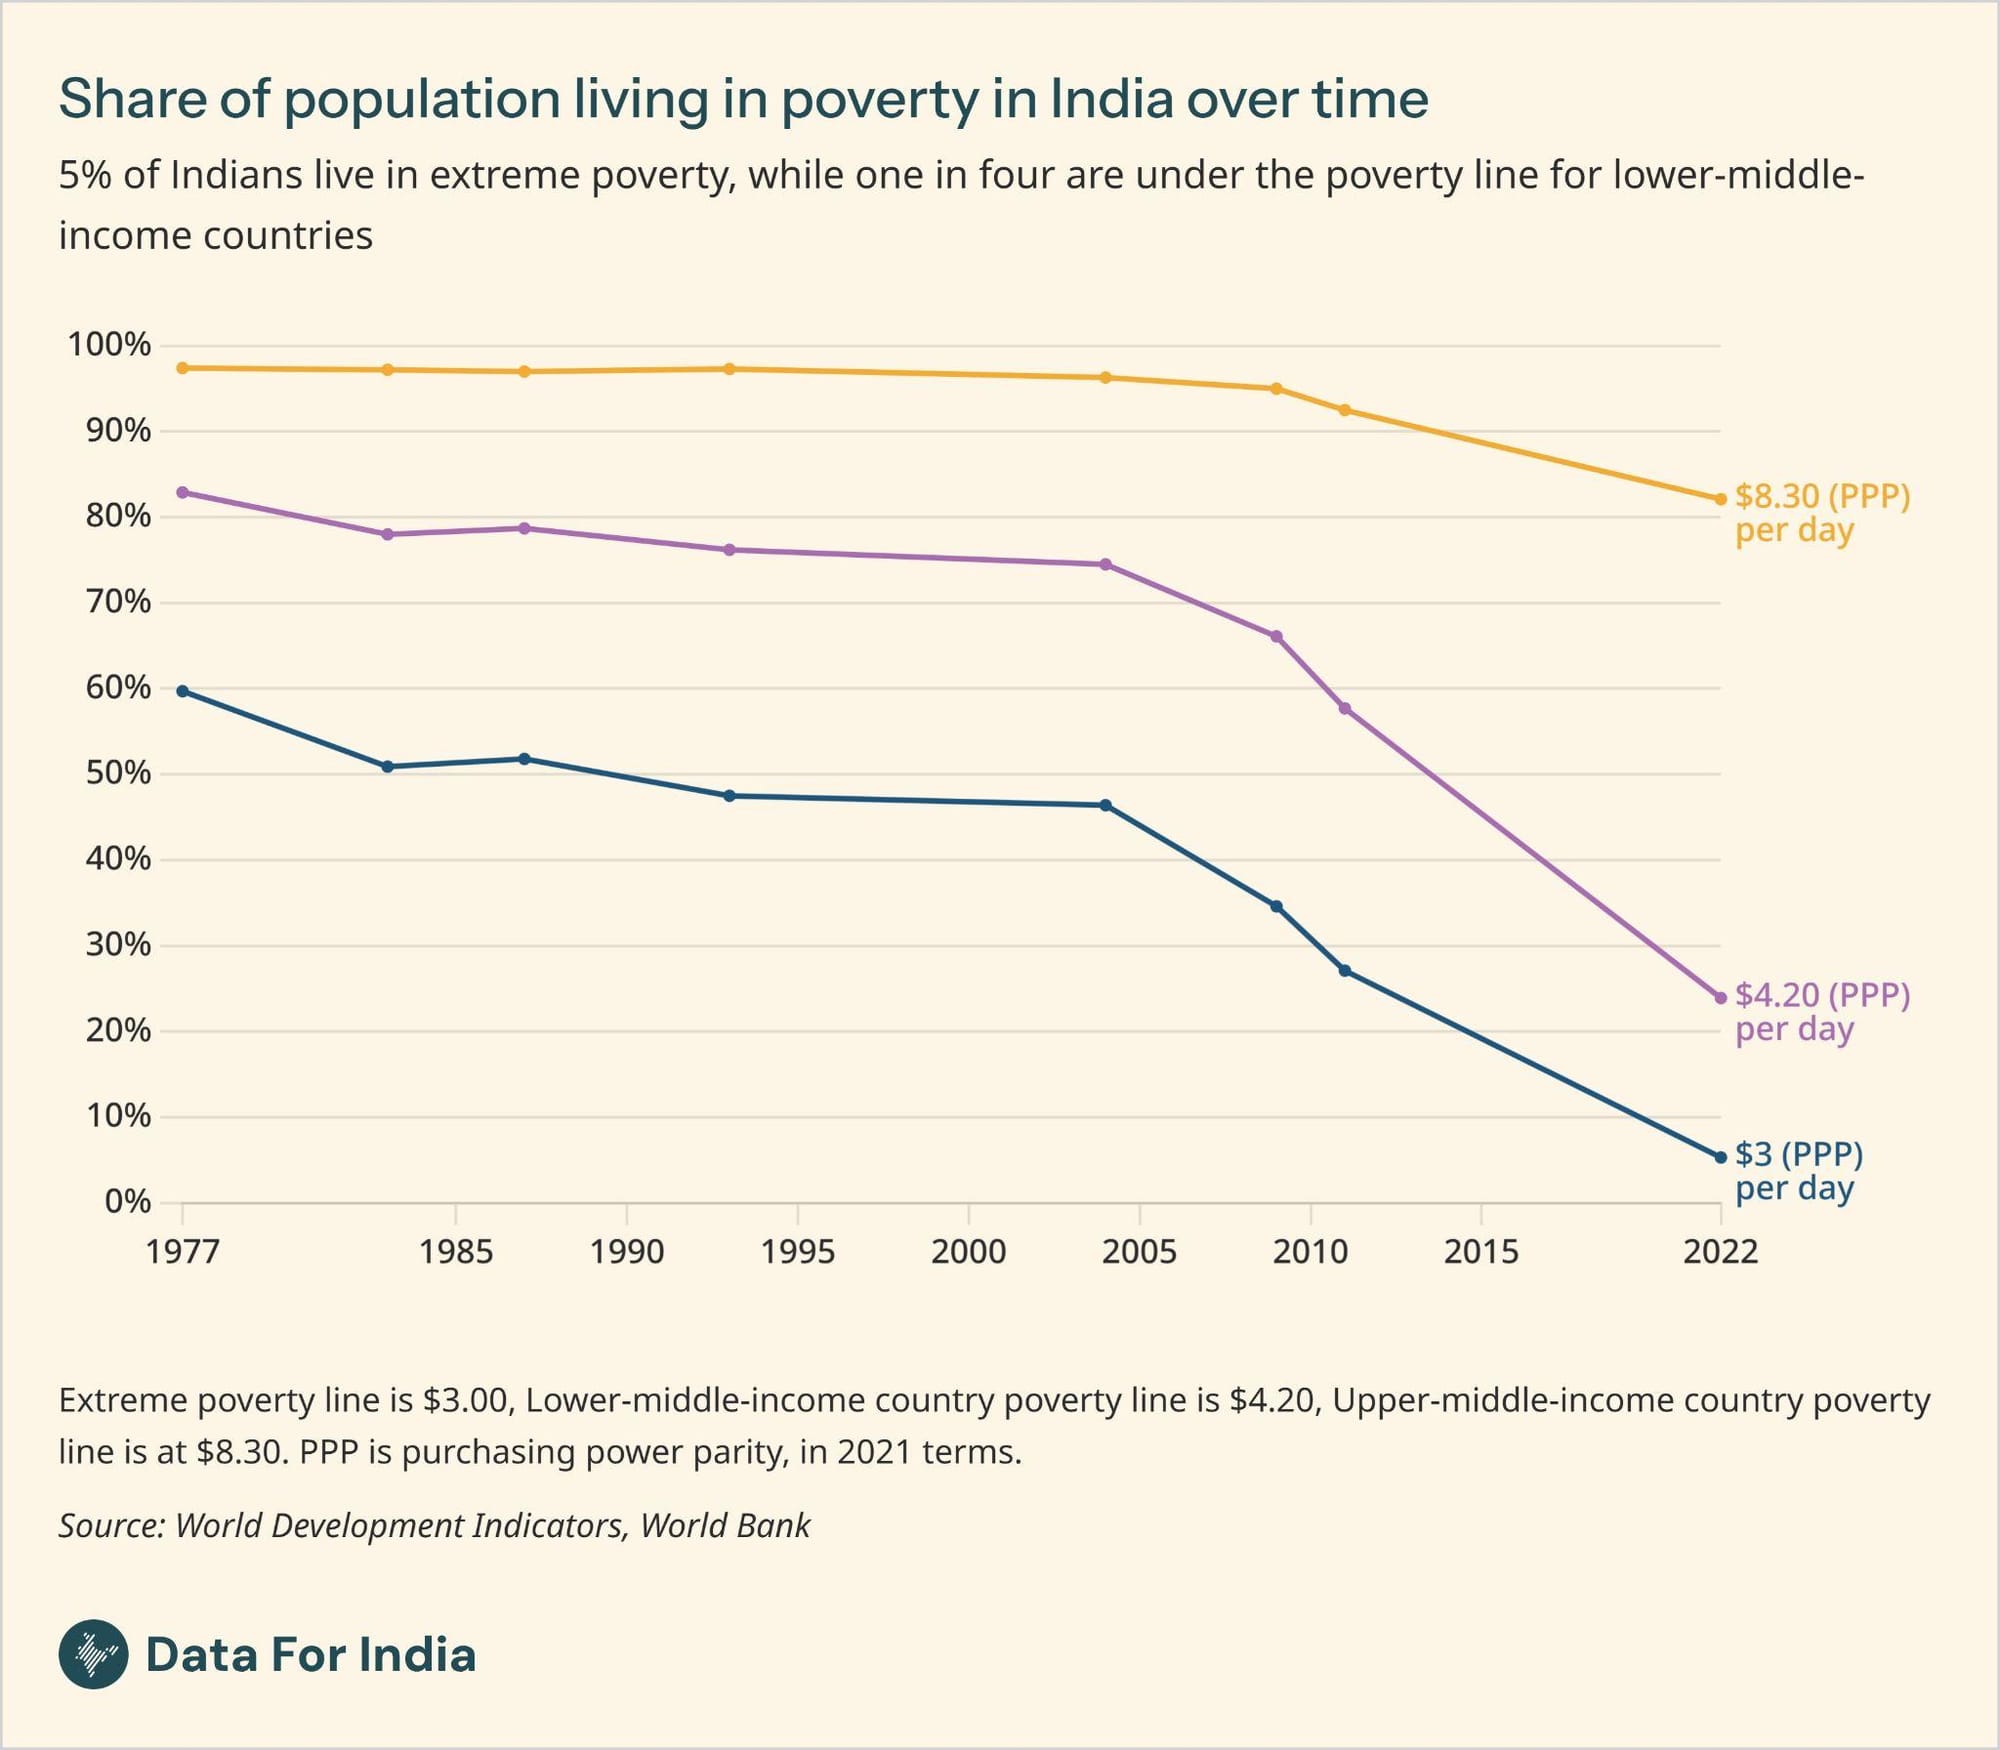
What poverty line you decide to look at is a choice. The extreme poverty line - the blue line in the chart - is the median of the national poverty lines of low-income countries. The Lower Middle Income Country (LMIC) poverty line - the purple line - is the median of the national poverty lines of lower-middle-income countries, including India. The Upper Middle Income Country (UMIC) poverty line - the yellow line - is the median of the national poverty lines of upper-middle-income countries.
Extreme poverty in India, by these definitions, is now at 5%. But is this how we want to define poverty in 2026? Here's one way to think about it: in Indian rupees, even the UMIC poverty line translates to a per capita spend of just Rs 166 per day, which is less than Rs 5,000 per month. But then that would put poverty in India at over 80%.
These are not purely statistical or economic conversations - they are sociological and political. By any definition, poverty in India has fallen. What's open to discussion is how we define it.