One of the most important ways to understand how families in India live is by looking at their household consumption expenditure - or how much money they spend in a month or year. This is particularly important in India, where until now, government surveys have not directly captured household incomes, owing to the challenges posed in accurately capturing the income of a household in an economy that is largely informal, and significantly agricultural.[1] As a result, consumption expenditure is the closest indicator we have to understand household-level prosperity, poverty and growth in living standards.
Since 1972, India's National Statistics Office (NSO) has been conducting Household Consumption Expenditure Surveys every five years to record household spending in India.[2] The most recent survey was conducted in 2023-24 and published in 2025. The recent HCE surveys significantly differ from past surveys in terms of methodology.[3]
In HCE surveys, trained enumerators ask a large, representative sample of households about their consumption of over 400 items - from salt to cars - within reference periods ranging from a week to a year.[4] The list of items includes basics such as food, clothing, rent, health and education, as well as discretionary spending items such as consumer durables. It also includes the quantity and value of some items of household consumption provided freely or at subsidised rates by governments, like foodgrains.[5] Consumption expenditure captured through these surveys excludes income tax, insurance premium payments, purchase or construction of land and real estate, charity and gifts.[6] (A more detailed account of how India measures household consumption is here.)
Household and per capita expenditure
The average Indian household spent a little under Rs 21,000 every month (USD 250 per month) on all goods and services in 2024.
Larger households may spend more than smaller ones on account of having more family members. As a result, the per capita spending becomes a better indicator of household prosperity than expenditure at the household level. Per capita expenditure is the household expenditure divided by the number of members of a household. India's Monthly Per Capita Consumption Expenditure (MPCE) was a little under Rs 5,000 or USD 60 in 2024.[7]
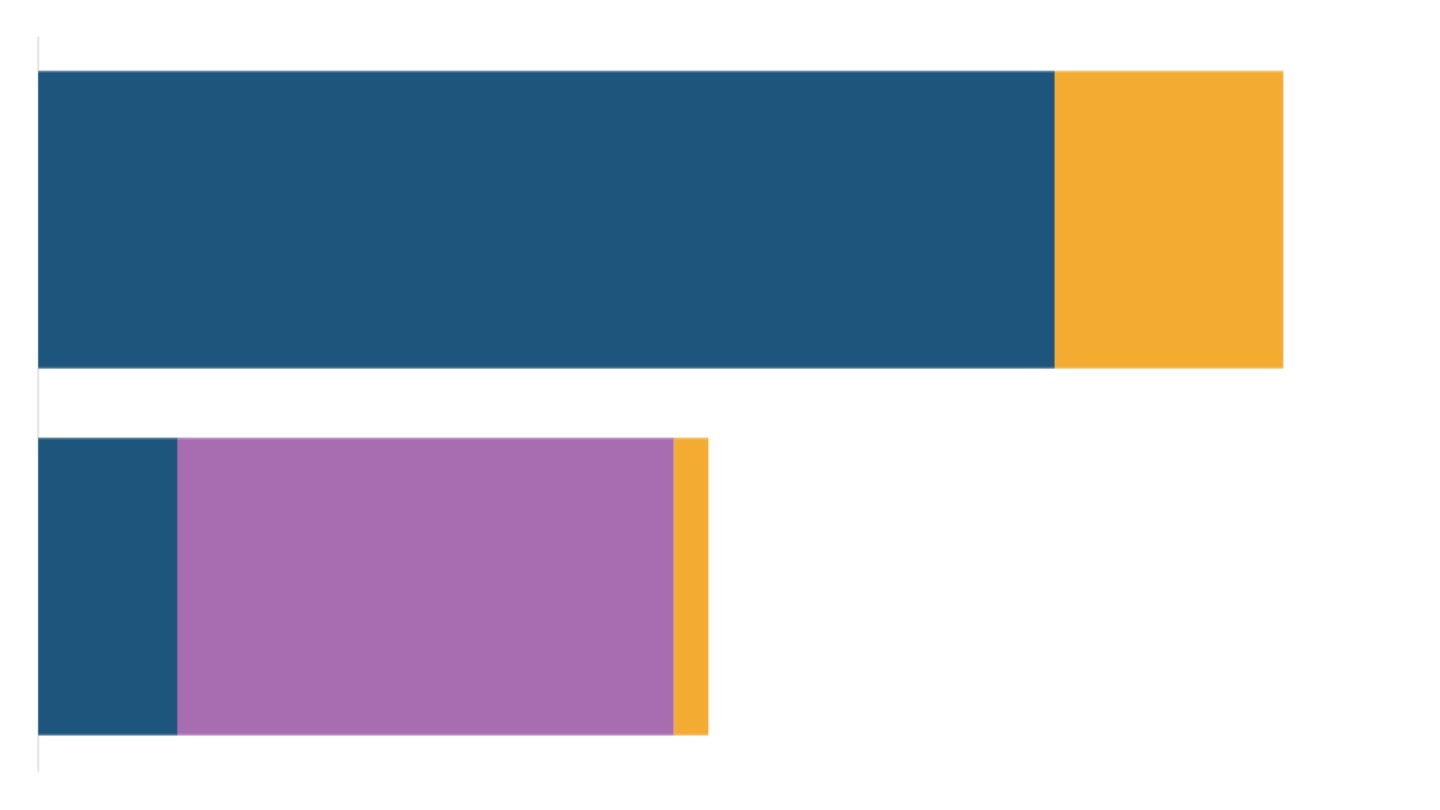
There is a considerable gap between urban and rural consumption expenditures. While the average person in rural India spends a little above Rs 4,000 in a month, an urban Indian spends around Rs 7,000 on average, or 70% more.
What do Indians spend on
Consumption expenditure is broadly divided into food and non-food categories. We look at the average monthly spending per person, or the mean MPCE, as the benchmark to look at how it is distributed across various items of regular consumption.
Food occupies the largest share in household spending in India. In the average MPCE of Rs 5,000, the food group accounts for nearly Rs 2,200. Nearly half of rural MPCE is on food, as against less than 40% in urban areas.
Within the food group, the biggest share of spending is reported on processed foods, which include packaged food, non-alcoholic beverages and purchased cooked meals. This is true of both urban and rural areas.
This is a substantial shift from the past, where raw cereals made up the bulk of food expenditure. In 2024, more than 10% of the average MPCE in India was on processed food.
The other part of consumer spending is on items other than food. Within non-food expenditure, spending on conveyance and purchase of durable goods occupies the biggest share. Conveyance includes spending on transport services such as buses, autos and airlines, in addition to expenditure on petrol and diesel for personal and rented vehicles.
Medical expenses that cover hospitalisation, doctor consultation and medicines make up 6-7% of India's average MPCE. Together, health and education account for more than 10% of average per-person monthly spending in India.
Rent is a notable expense item only in urban areas, since rental living is common in cities but uncommon in villages. About 7% of average urban MPCE in India is on rental payments.
Socio-economic disparities
National averages in a country of India's size do not always capture the variations that exist between different groups.
Economic groups
One way to understand how consumption expenditure varies in the country is to arrange the population in order of increasing consumption expenditure (MPCE) and then divide them into five equal groups, or "quintiles".
The gap in average MPCE is the largest between the fourth and fifth quintile, suggesting that the inequalities in spending at the top of the income ladder are greater than those at the bottom.
Urban expenditure is higher than rural expenditure at every quintile, but the urban-rural gap is most pronounced in the highest quintile. In the lowest quintile, the average urban MPCE is 50% higher than the average rural MPCE. In the highest quintile, however, urban MPCE is 90% more than rural MPCE.
Within the top quintile, the average consumption expenditure is driven up by a relatively small group. In urban India, the average MPCE of the top 5% (accounting for roughly 25 million people), is a little above Rs 20,000, and that in rural areas is a little above Rs 10,000 (approximately 45 million people).[8]
A person belonging to households that make up the top 1% of the urban population spends on average more than Rs 30,000 per month on domestic needs. Similarly, the average MPCE of the top 1% in rural areas is a little more than Rs 15,000.
Social groups
People belonging to marginalised groups, including those belonging to India's Scheduled Castes (SCs) and Scheduled Tribes (STs), have lower consumption expenditures, while among religious groups, Muslims and Buddhists have lower levels of consumer spending.
The average MPCE among marginalised groups is 20% to 40% lower than among others not categorised as socially disadvantaged.
Regional variations
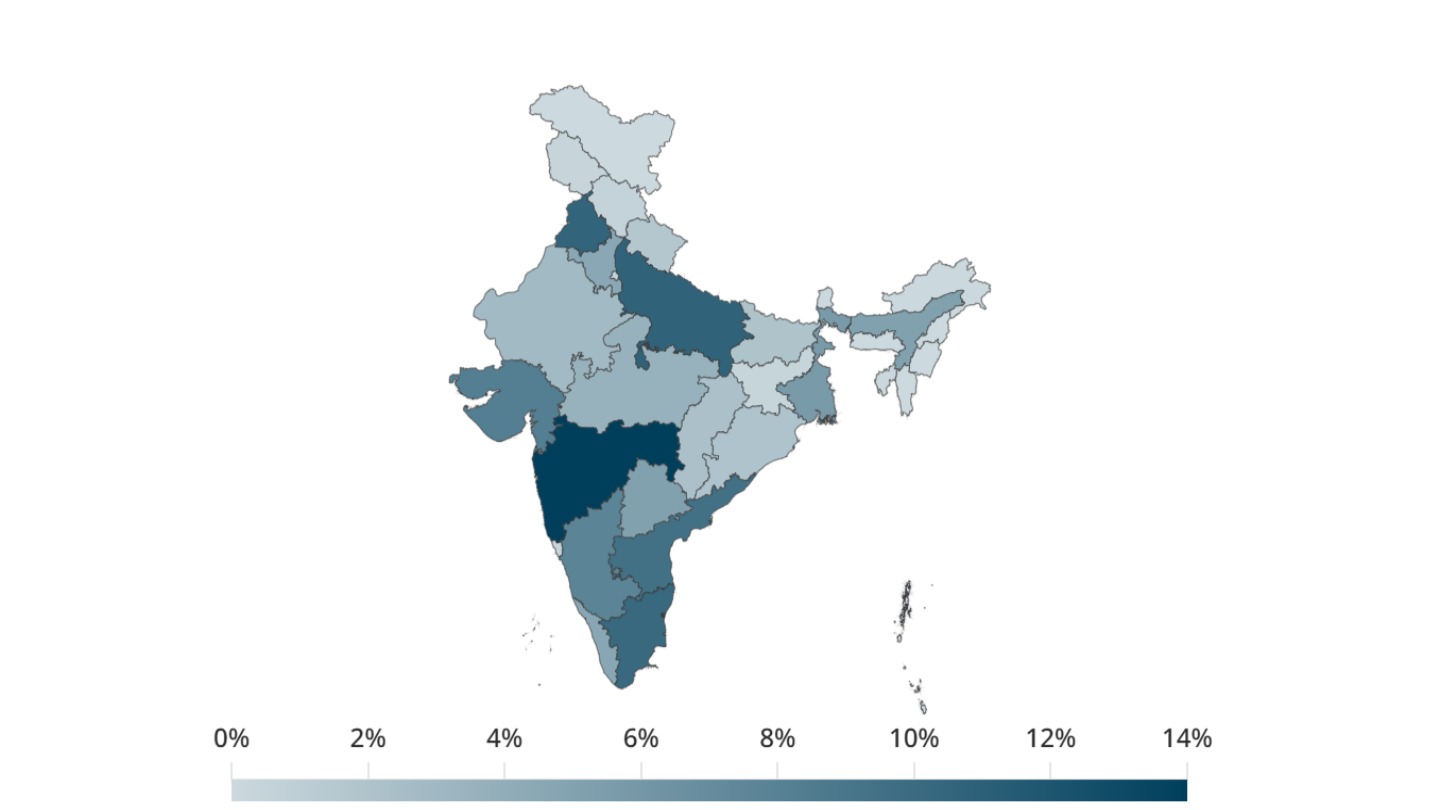
Households in the relatively richer states of India have a higher MPCE than their counterparts in relatively poorer states. States in central and eastern India have lower MPCE than states in the south and those around the national capital Delhi. The average MPCE in Kerala and Tamil Nadu is double that of Chhattisgarh and Jharkhand.
Changes over time
The 2023 and 2024 consumption expenditure surveys used a revised methodology that included changes in the way the sampled households were canvassed, as well as a changed format of asking questions. Although these changes potentially affect the comparability of new data with data from older HCE surveys, the NSO has said that estimates of consumer spending are broadly comparable over time.[9] (For a detailed discussion of these changes, read our Measurement piece on consumption expenditure.)
However, a simple comparison of consumption expenditure over time can be misleading. The change in consumption expenditure between two time periods is made up of two things: changes in the volume of consumption and changes in the prices of goods and services. With prices generally rising over time, it can become difficult to see how much consumption actually grew. Economists do this by adjusting for price rise, or adjusting for inflation.
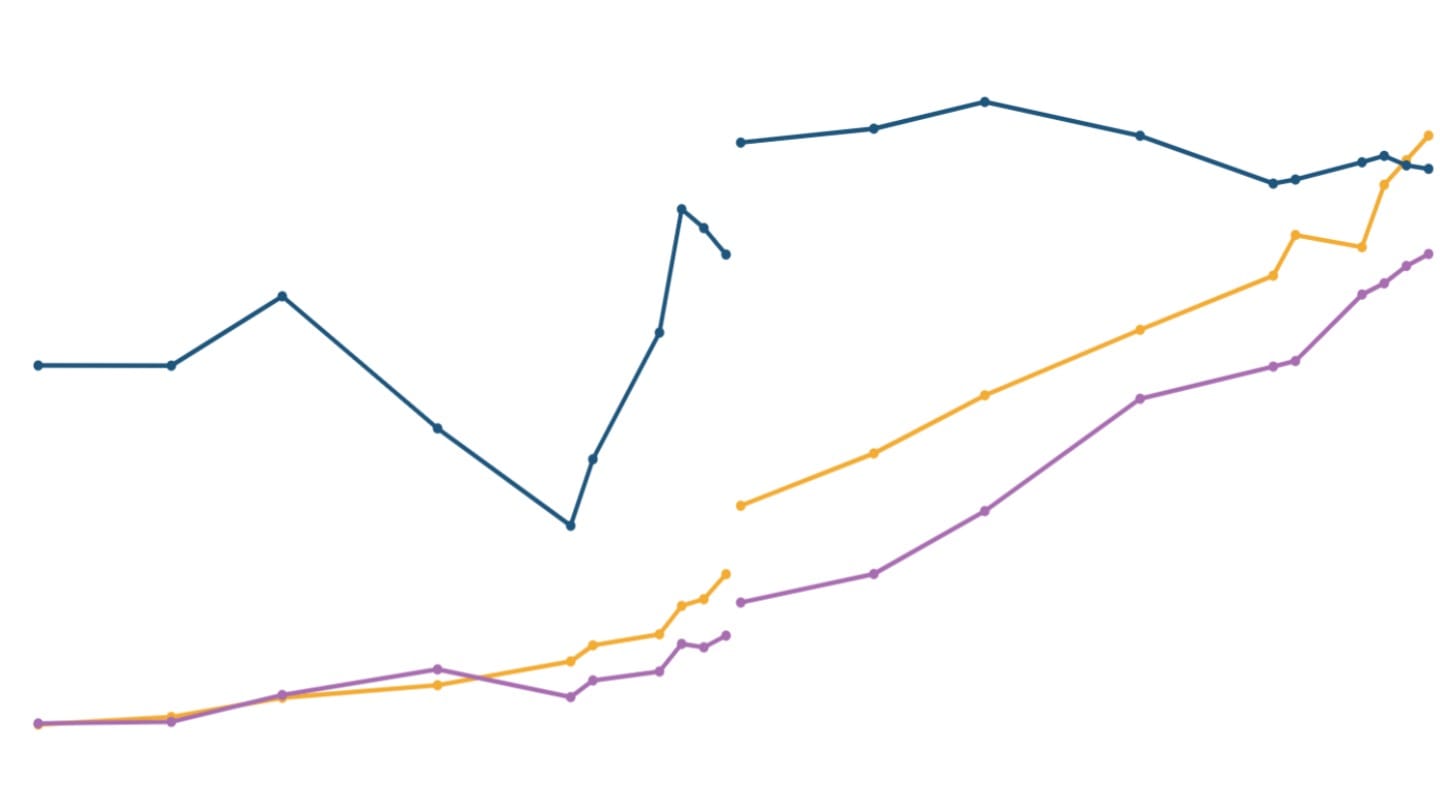
Adjusting expenditures for inflation shows the change in consumption expenditures in "real terms".[10] This shows that consumption expenditure grew in both nominal and real (inflation-adjusted) terms over time, but at different rates of growth.[11]
While nominal MPCE grew nearly eight times between 2000 and 2024, real MPCE doubled in the same period.
Falling share of food
The share of food in total expenditure has gradually fallen over the last few decades.[12]
Food made up less than half of rural and urban monthly expenditure in 2024. In the 1960s, 80% of the rural household budget and nearly 70% of the urban household budget, on the other hand, was on food alone. This is in line with trends seen across the world, where growth in household incomes and a move away from manual labour leads to a relatively lower share of spending on food.[13]
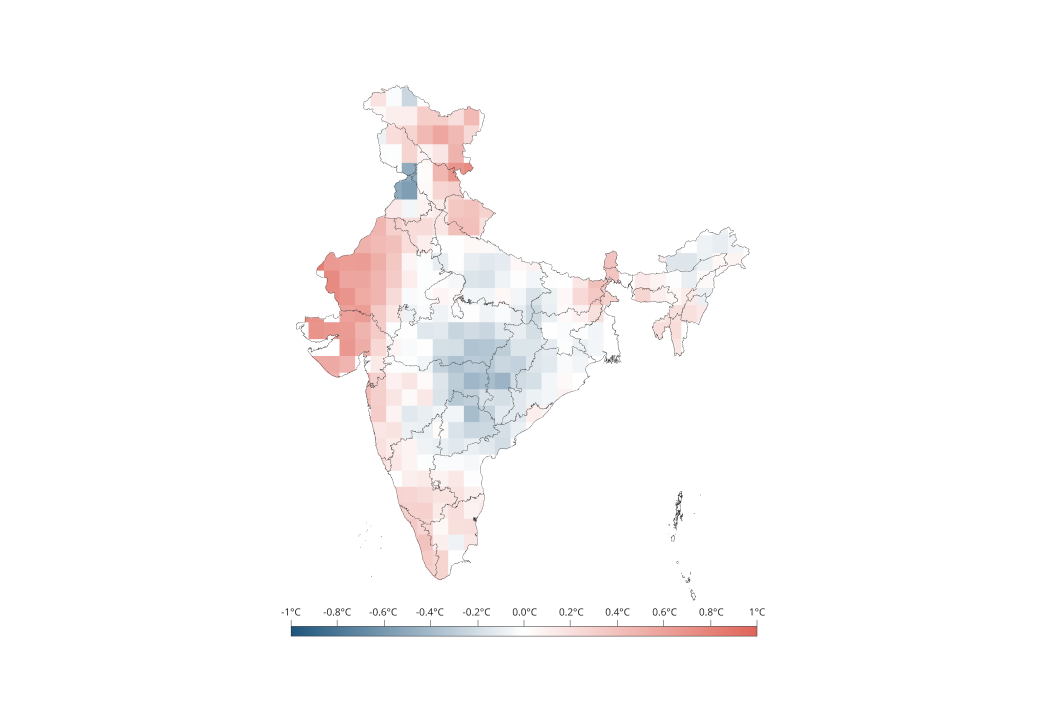
The declining share of food in MPCE is driven by a big decline in relative spending on cereals. Indians now consume a smaller absolute quantity of cereals per person per month than before. From 2000 to 2024, the quantity of cereals consumed by an individual has dropped by nearly 25%.[14]
Additionally, the expanded National Food Security Act now provides free grains to 75% of the rural and 50% of the urban population in India. As a result, spending on cereals now occupies less than 5% of the MPCE (2024), from 22% in rural areas and 12% in urban areas in 2000.
On the other hand, fruits, eggs, fish and meat, processed food have seen their share in MPCE rise over the last few decades. One of the most significant changes in Indian spending has been the increased expenditure on processed foods, which include packaged food, non-alcoholic beverages and purchased cooked meals. Their share in the monthly per capita consumption expenditure has nearly doubled in the last two decades.
Rising non-food expenditures
Since 2000, while expenditure on food grew seven times, per capita non-food spending grew nearly eleven times in India, in nominal terms.
Within non-food expenditure, spending on transport and the purchase of durable goods has grown the most in the 24-year period. In 2024, about 8% of MPCE was spent on conveyance in 2024, compared to 3% in rural areas and 6% in urban areas in 2000.
The share of monthly spending on durable goods (including furniture and large appliances) in MPCE has more than doubled to about 7% in 2024. In urban India, spending on education is another area that has seen substantial growth.
[1] The National Statistics Office at the Ministry of Statistics and Programme Implementation will complete its first household income survey in 2027.
[2] The first HCES was carried out in 1950, but the five-yearly surveys that are comparable to current data began in 1972. The 2017-18 survey data was withdrawn, so the 2022-23 survey was the first one since 2011-12. MOSPI conducted another round of HCES in 2023-24.
[3] Until now, the entire HCES questionnaire was canvassed in a single visit for each household. Since 2023, enumerators visit every household in the sample three times in successive months to canvas the questionnaire that is split into three parts.
The latest HCES also uses land ownership and distance to urban centres as key criteria in the sampling design and household selection for rural areas, and car ownership as the criterion in urban areas. The previous HCES used consumption expenditure data from older surveys or assessed the relative affluence of households in the household selection procedure.
[4] For food items, intoxicants such as pan and alcohol, and the energy consumed in cooking and electricity, the respondent is asked the quantity as well as the value of consumption. The value or the amount spent is recorded either directly (if the respondent knows it), or using prices prevalent in the region multiplied by the recorded quantity. For all other items, the respondent gives only the amount spent.
[5] The state provides free as well as subsidised food to households in India (both central and state governments). The recent survey captures the quantity of cereals in three parts: free, subsidised (under the public distribution system) and from other sources, mainly from the market. The quantity and value are recorded separately for each of them. The value of freely received cereals can be imputed using prevalent prices.
[6] While insurance premium is not a part of consumption expenditure, medical bills paid by insurance companies are included.
[7] The HCES 2023-24 finds that the average household has between four and five people, and the mean of household size at the national level is 4.17.
[8] The HCES assigns a weight to each household (and each household member) such that the weighted count of all households in the total sample gives the total absolute number of households in the country (or the country's population). But this population estimate may not conform with the official population estimate from the Census. To produce more reliable population-level estimates, we use a two-step process while deriving any estimate in absolute terms. We use ratios from the survey, and apply the ratio to the official population estimate from the Registrar General and Census Commissioner of India.
[9] Apart from the changes in sampling methodology and questionnaire canvassing (discussed in a footnote above and detailed in the Measurement piece), the list of items for which expenditure was recorded has increased from about 350 in the last HCES (2011-12) to 400+ in the latest two rounds (2022-23 and 2023-24). Despite these changes, the official report that accompanies the HCES data makes time series comparisons.
[10] The National Statistics Office uses the ratio of prices (price indices) to deflate or inflate prices over a period. The Consumer Price Index for Agricultural Labourers (rural) and CPI Industrial Workers (urban) are used to inflate the consumption expenditures in years prior to 2011 to prices of 2011-12 (base year). Similarly, the 2012 series of Consumer Price Index - Rural and Urban (base 2012) is used to deflate the consumption expenditures in years after 2011, to 2011-12 prices.
[11] For nominal and real MPCE over the years, we use the data published in the official report of HCES 2023-24.
[12] In economics, the fall in the share of food in total consumer expenditure is known as the Engel's Law, and it observes that the share of non-food items grows faster than food items as household income grows.
[13] Food accounts for 15% of the disposable income in advanced economies like the US and Germany.
[14] HCES 2023-24.