Welcome to Issue #6 of The Roundup, Data For India’s monthly newsletter bringing you our latest work, new features and major updates, right into your inbox.
In this month’s edition: how India’s temperatures are changing across seasons, a closer look at people in prison awaiting trial, and a way to embed our interactive charts in your own work.
The Spotlight
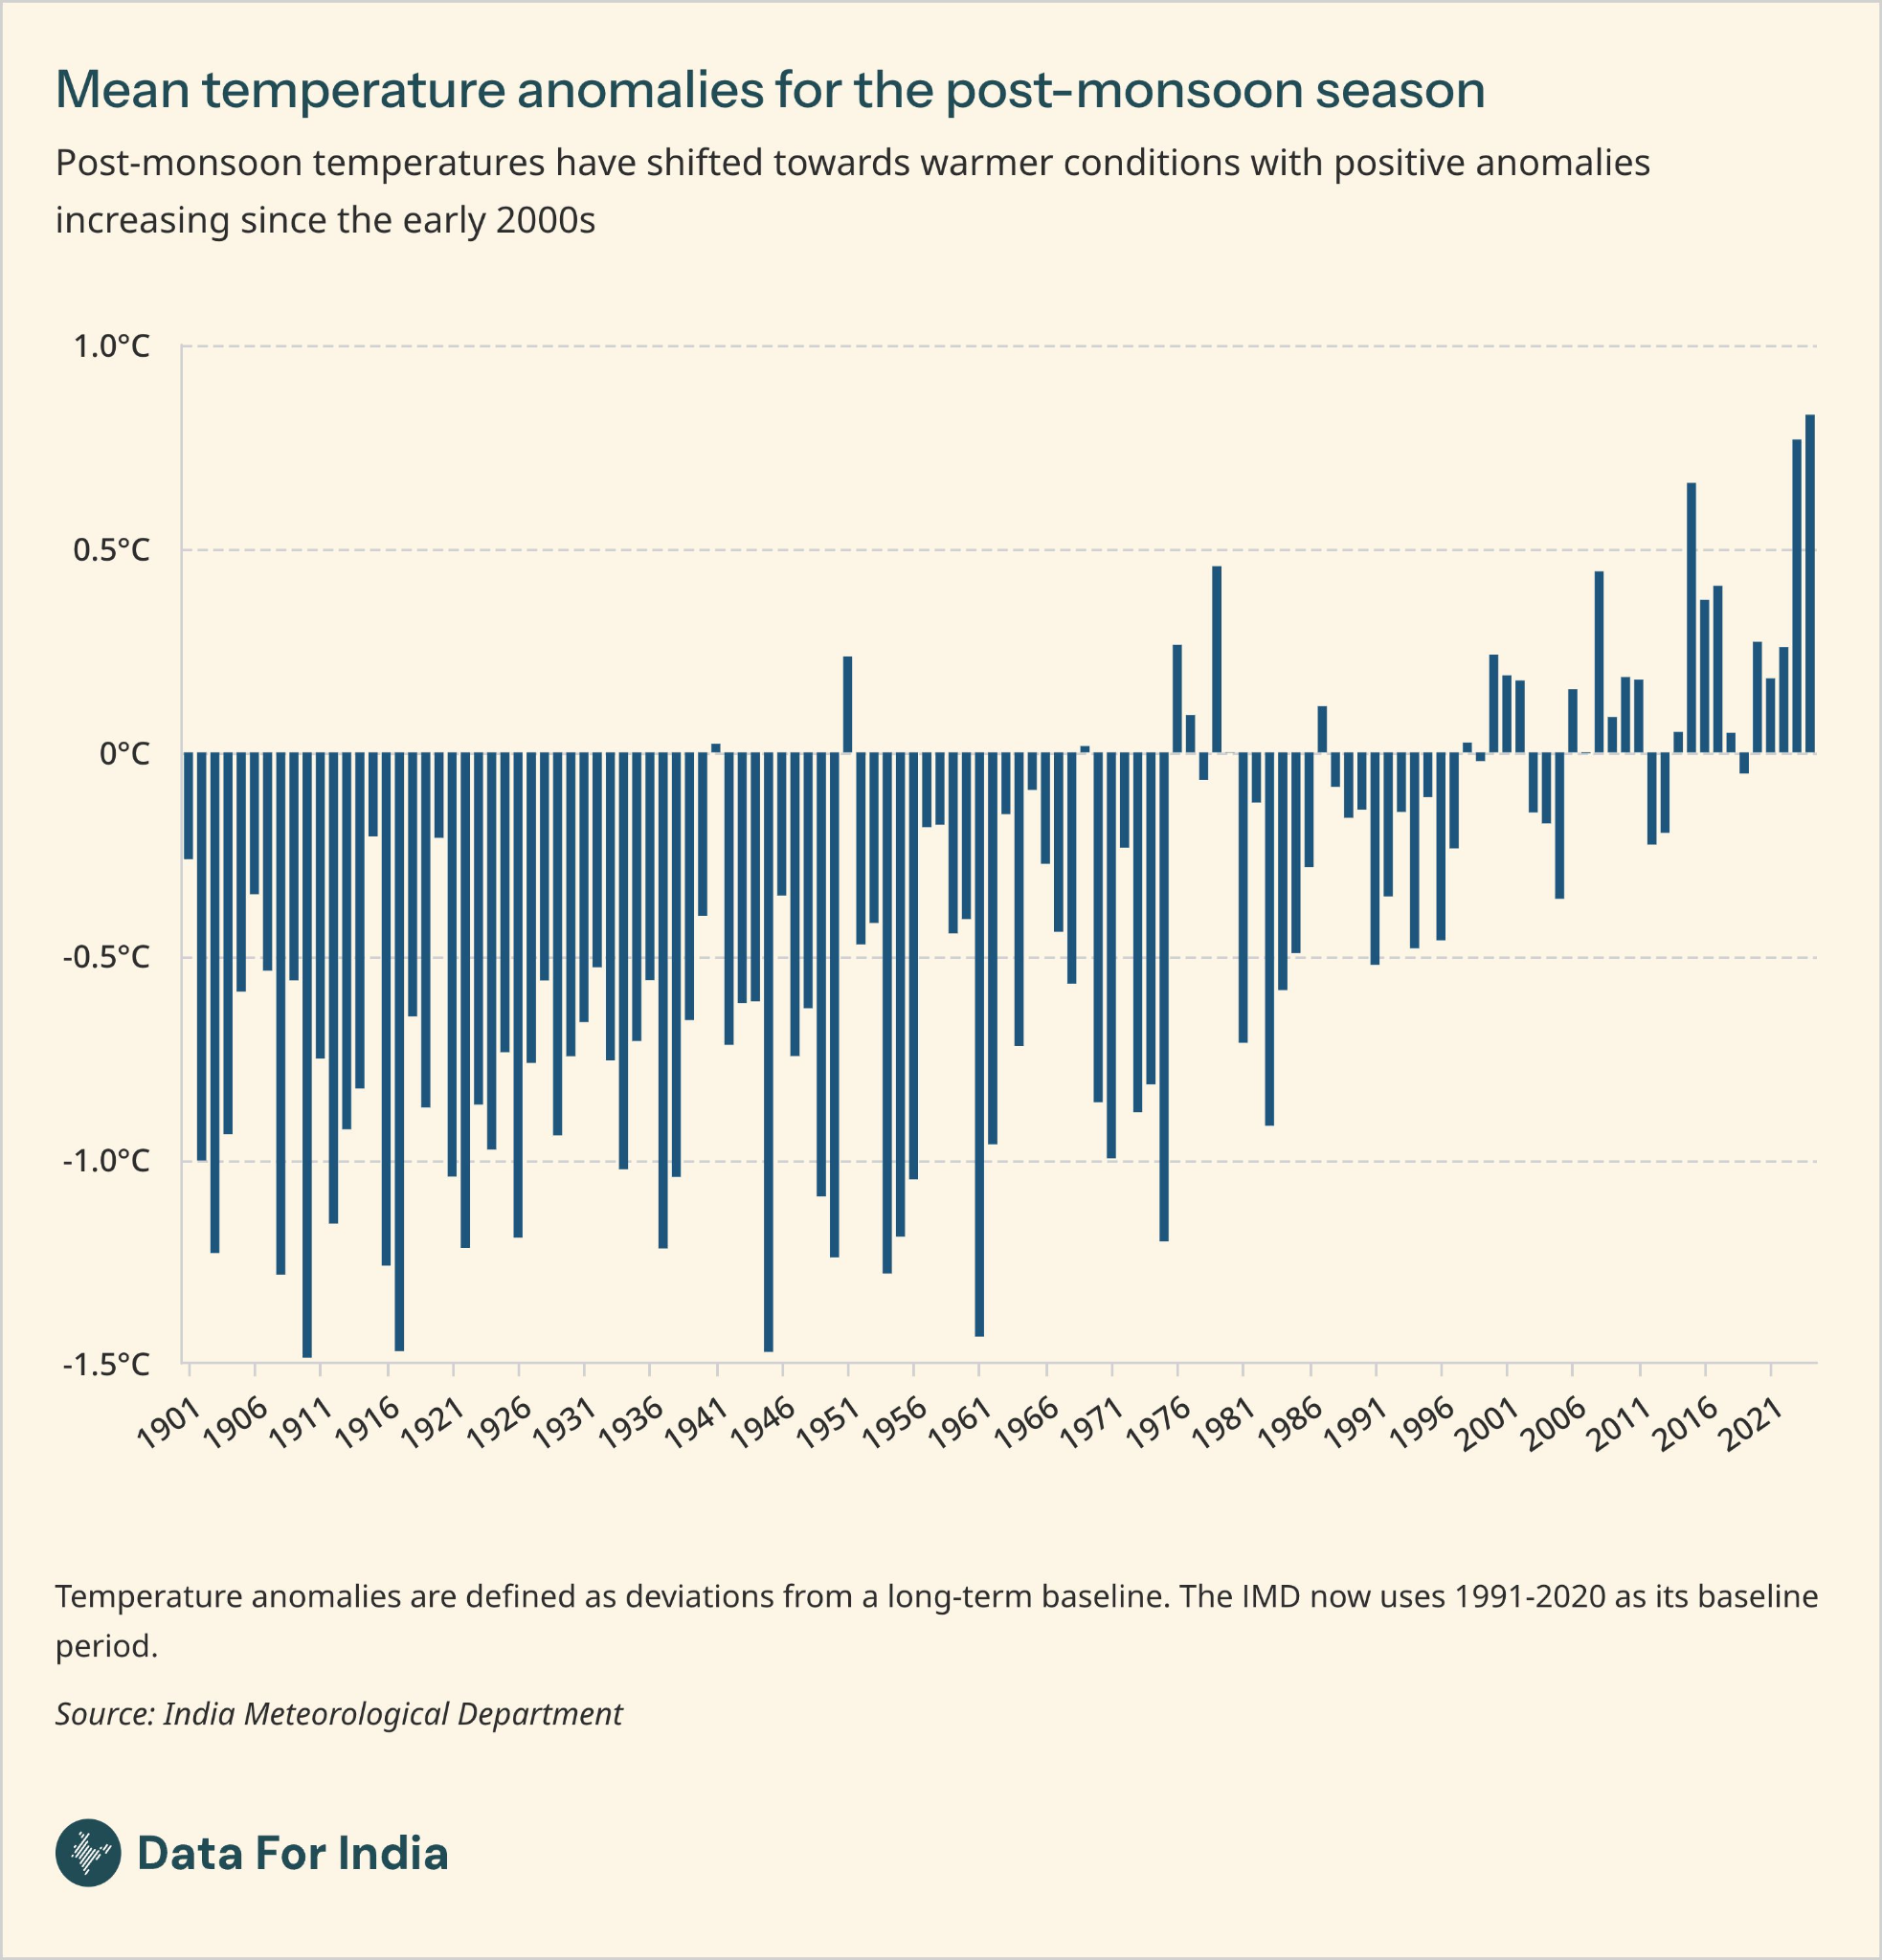
India’s warming extends beyond summer
Heat in India is often associated with the summer months. However, long-term temperature data shows that the post-monsoon season, from October to December, has warmed faster than any other season. Using India Meteorological Department (IMD) data for 1901–2024, Juhi Chatterjee finds that mean post-monsoon temperatures rose by 0.10°C per decade.
In 2024, which was the warmest year in the observational record since 1901, the post-monsoon season was 0.83°C warmer than its 1991–2020 seasonal baseline, the largest departure among the four seasons that year. All four seasons show a long-term rise in mean temperature, but at different rates.
Read Juhi’s analysis of seasonal temperatures to see how warming differs through the year. Pair it with earlier work on regional variations in seasonal temperatures to add a geographical view to warming in India, where gridded maps for 2015–2025 highlight winter temperatures above the 1991–2020 baseline most consistently across the country.
New On The Platform
- Understanding India’s undertrial population. About three in four inmates in India’s prisons were undertrials, yet to be convicted or acquitted, at the end of 2023. Ameya Bokil looks at the offences they were accused of, differences across states and the growing share held for longer periods. This work builds on his earlier analysis of India’s prison population, which covered incarceration and overcrowding.
- Tobacco consumption in India. Between 2006 and 2021, both smoking and tobacco chewing declined among men aged 15–49. The drop in smoking was larger in percentage-point terms. Nileena Suresh explores how tobacco use varies by wealth, gender and geography, and her companion Data Byte compares the share of people who reported using tobacco across age groups.
- North-eastern states have the highest shares of workers in government jobs. Just 6% of workers in India on average are in the public sector, compared with about one in four in Mizoram, Nagaland and Sikkim. Abhishek Waghmare also finds that the share falls to just 3% in Bihar, Madhya Pradesh and Uttar Pradesh, where more than 90% of workers are employed in household enterprises.
- The richest Indian households can eat fruit most often. People in India’s richest households are nearly twice as likely to eat fruit every week as those in the poorest, while fried food consumption is similar across both groups. Nileena Suresh explores this divide and how the greater affordability and availability of unhealthy foods may leave poorer households more exposed to both undernutrition and diet-related health issues.
One Thing To Try
Bring our interactive charts to your readers
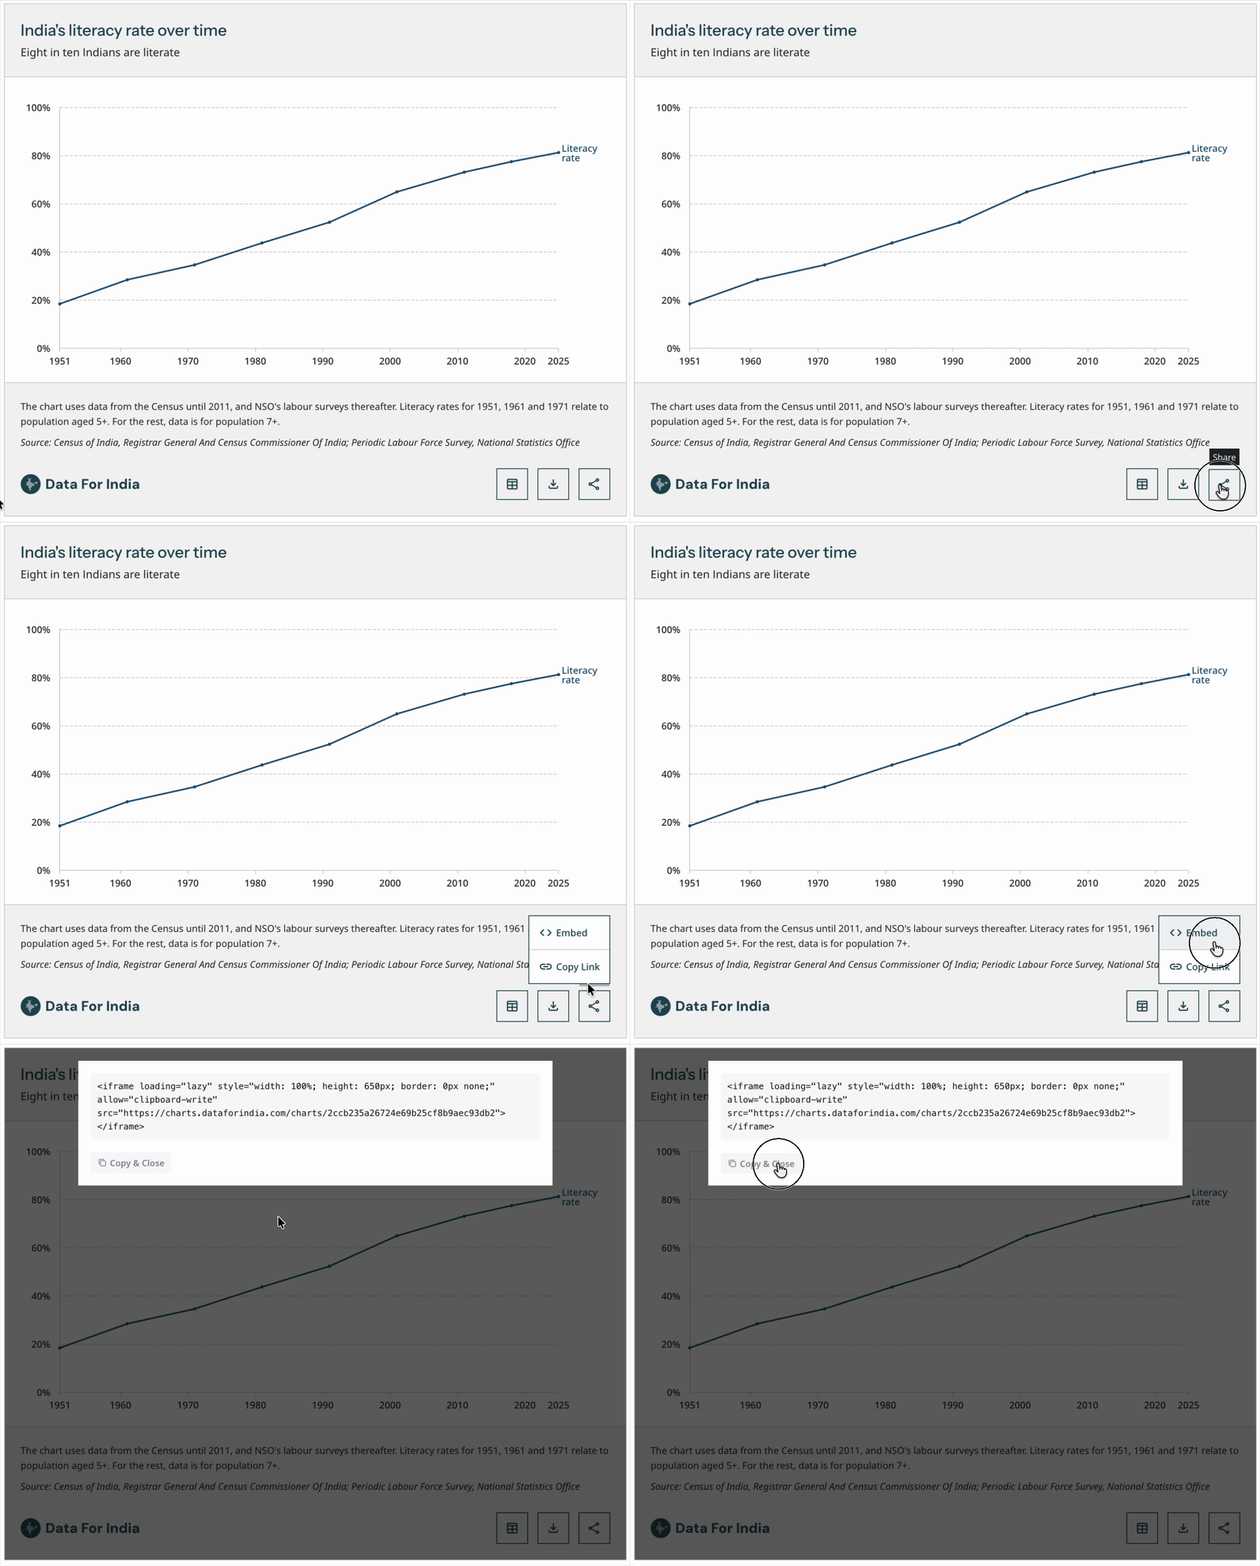
Came across a chart on Data For India that you would like to share with your readers? You can embed it directly in your news story or academic report, so your readers can explore the data on the same page.
Publications including The Wire, Scroll and CASI already use our interactive charts in their work. Here is how you can do it too:
- Choose a chart you would like to share. For example, try the post-monsoon temperature chart in our seasonal temperature analysis.
- Open the chart’s share menu and select “Embed”.
- Select “Copy & Close” to copy the embed code from the pop-up.
- Paste the code into your website or publishing platform, wherever it supports iframe embeds.
Remember to credit Data For India and link to the original article. Our guide to using and citing our work has all the details.
Conversations We Joined
- On October 4, our founder Rukmini S spoke at DesignUp 2026 about how data can shape, and sometimes unsettle, the way we see India and the design decisions that follow.
- On October 22, Rukmini S spoke at the M S Swaminathan Research Foundation in Chennai on “What stories can data tell us about India?”, introducing them to Data For India’s work to expand understanding of the country through data.
- On October 23, Abhishek Waghmare joined a stakeholder consultation in Mumbai on Maharashtra’s proposed Employment Market Information System. He discussed which employment indicators to track and how combining household and enterprise survey data could help the state better understand labour demand and supply.
- On October 25, Rukmini S spoke at Pint of View in Chennai, about what data can and cannot tell us about India, including how statistics shape assumptions about inequality, cities, crime and the middle class.
Talking Point
One chart worth sitting with this month, from a Data For India team member.
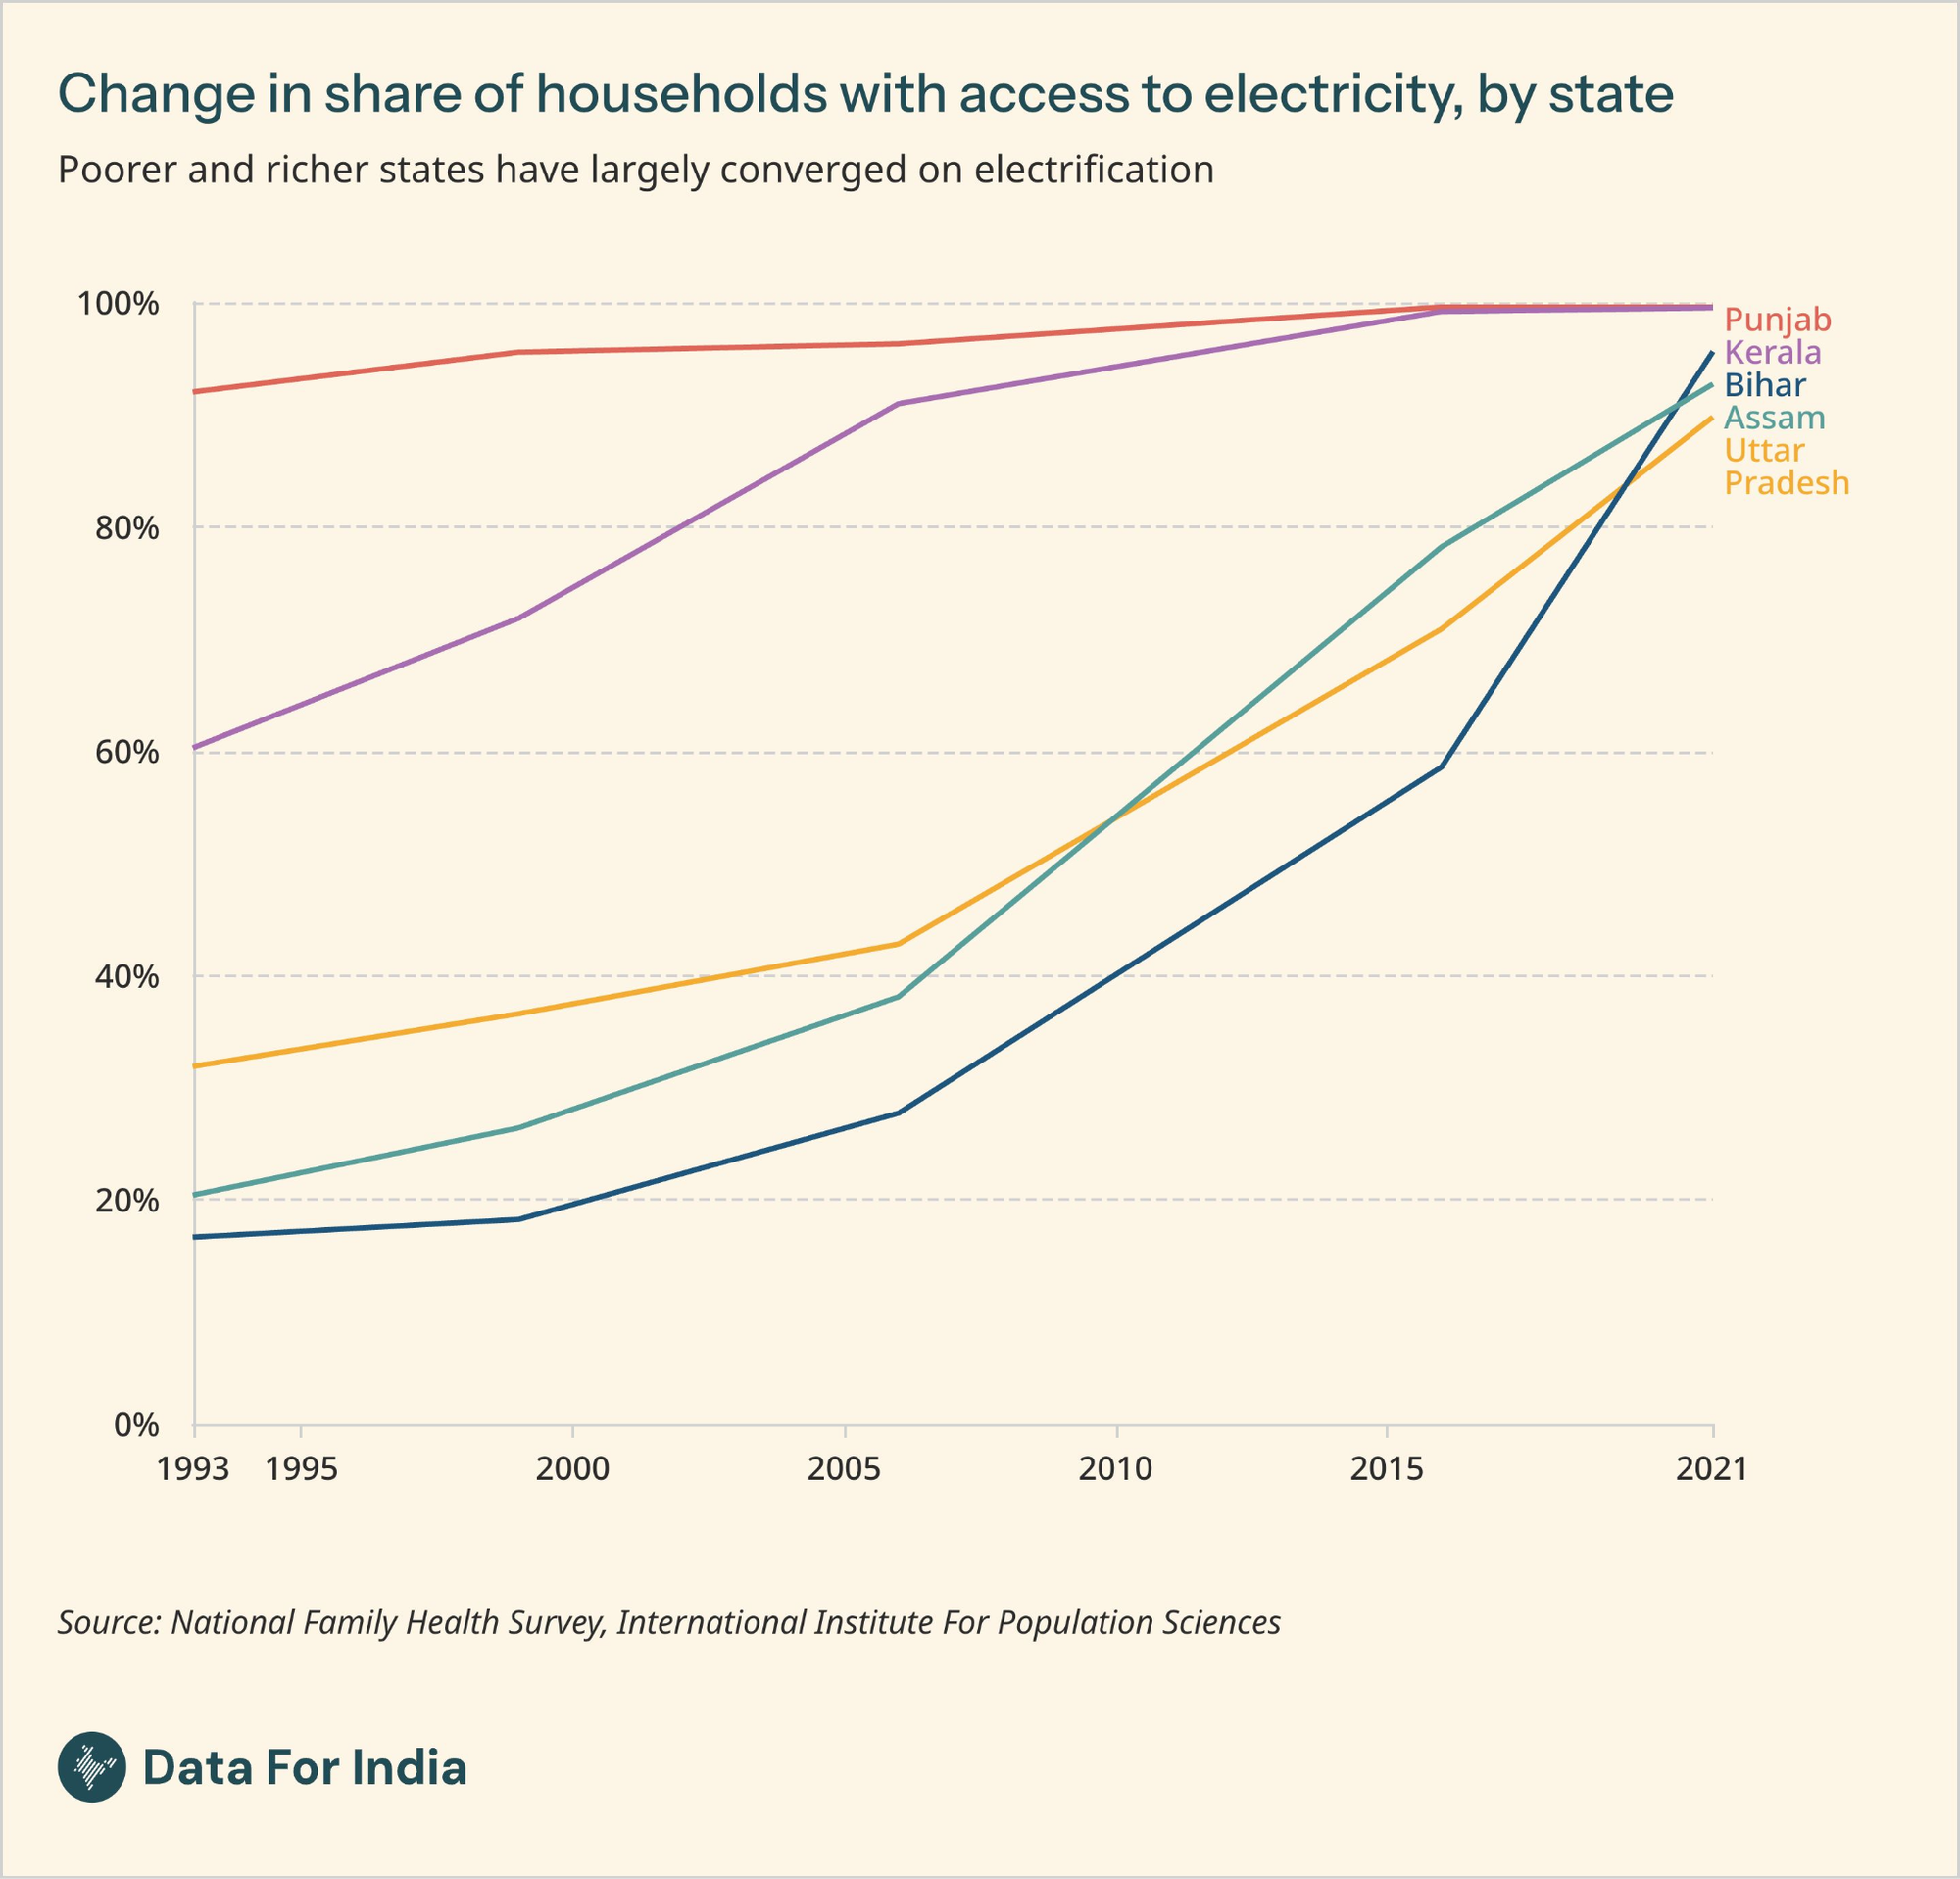
Electricity is the lifeline of an increasingly digital society. For me, the catch-up by states with lower administrative capacity relative to their stronger counterparts raises hopes for similar convergence in health, education and beyond. This convergence is even clearer in NFHS-6 (2023–24), which now puts electricity access at atleast 96% across all states. With access now so widespread, it is time for our surveys to ask not just whether homes have electricity, but also for how many hours a day and how consistently.
— Nandlal Mishra, Head of Research
That is it for the October 2026 edition of The Roundup. Have a question about our latest work, or an example of how you have used our charts or data? Reply to this email or write to us at info@dataforindia.com.
See you again on the last Friday of next month.