Climate has never been static, and natural variability has always been part of the climate system. Temperatures and rainfall can swing considerably from one year to the next, influenced by natural phenomena.[1] Understanding whether these events are becoming more frequent, intense or persistent is crucial.
This is particularly crucial for a nation like India which is highly vulnerable to the impacts of climate change, and where agriculture, water security, and energy planning depend on the nature of the monsoon. Understanding the data thus begins with distinguishing between related but fundamentally different concepts: weather, climate, variability and climate change.
This explainer looks at these concepts and examines how natural variability, human-driven warming and interactions within the climate system shape the conditions we experience.
Defining the core concepts
Interpreting climate data requires distinguishing between weather, climate variability and climate change. They describe the same Earth system at different timescales, but answer different questions.
- Weather is the state of the atmosphere at a particular place and time, whether it is hot today, raining this afternoon or windy tomorrow. It can change over minutes, hours and days and is described using variables such as temperature, precipitation, humidity, wind and atmospheric pressure. Because atmospheric processes are complex and chaotic, the predictability of weather generally decreases as the forecast period increases.
- Climate describes the longer-term statistical characteristics of weather. It tells us what conditions are typical at a place, how much they normally vary and how frequently extremes occur. Climate is generally assessed using observations over periods of around 30 years or longer. Climate therefore describes not just the average, but also the variability and distribution of weather conditions.
- Climate variability refers to short- to medium-term fluctuations (typically from months to a few decades) in climatic variables around a long-term average. In observed data, this is reflected in year-to-year ups and downs, with some years or short periods being warmer or cooler than a baseline. These variations are typically driven by natural processes within the climate system such as ocean-atmosphere interactions and do not exhibit a consistent long-term direction.[2]
- Climate change, in contrast, refers to a persistent shift in the statistical characteristics of the climate - such as its average, variability or the frequency and intensity of extremes - over longer periods of 30 years and beyond. As defined by the Intergovernmental Panel on Climate Change (IPCC), it is "a change in the state of the climate that can be identified by changes in the mean and/or the variability of its properties and that persists for an extended period, typically decades or longer".[3]
The distinction is important because a single event does not necessarily indicate a trend. A heatwave is a weather event; an unusually hot year may reflect climate variability; but a persistent increase in the frequency or intensity of extreme heat over time can indicate a changing climate.
Climate variability and climate change
Climate variability and climate change are related but distinct processes. The difference becomes clearer when climate data are examined across different timescales. Variability describes fluctuations around the prevailing climate pattern, while climate change describes a persistent shift in that pattern over decades or longer.
How do we distinguish between climate variability and climate change?
The distinction ultimately depends on how the data is examined. Examining long-term temperature trends in India can be one way to understand this distinction. Annual observations capture year-to-year variability, while longer-period averages smooth some of these fluctuations and make persistent changes in the underlying temperature more visible.[4]
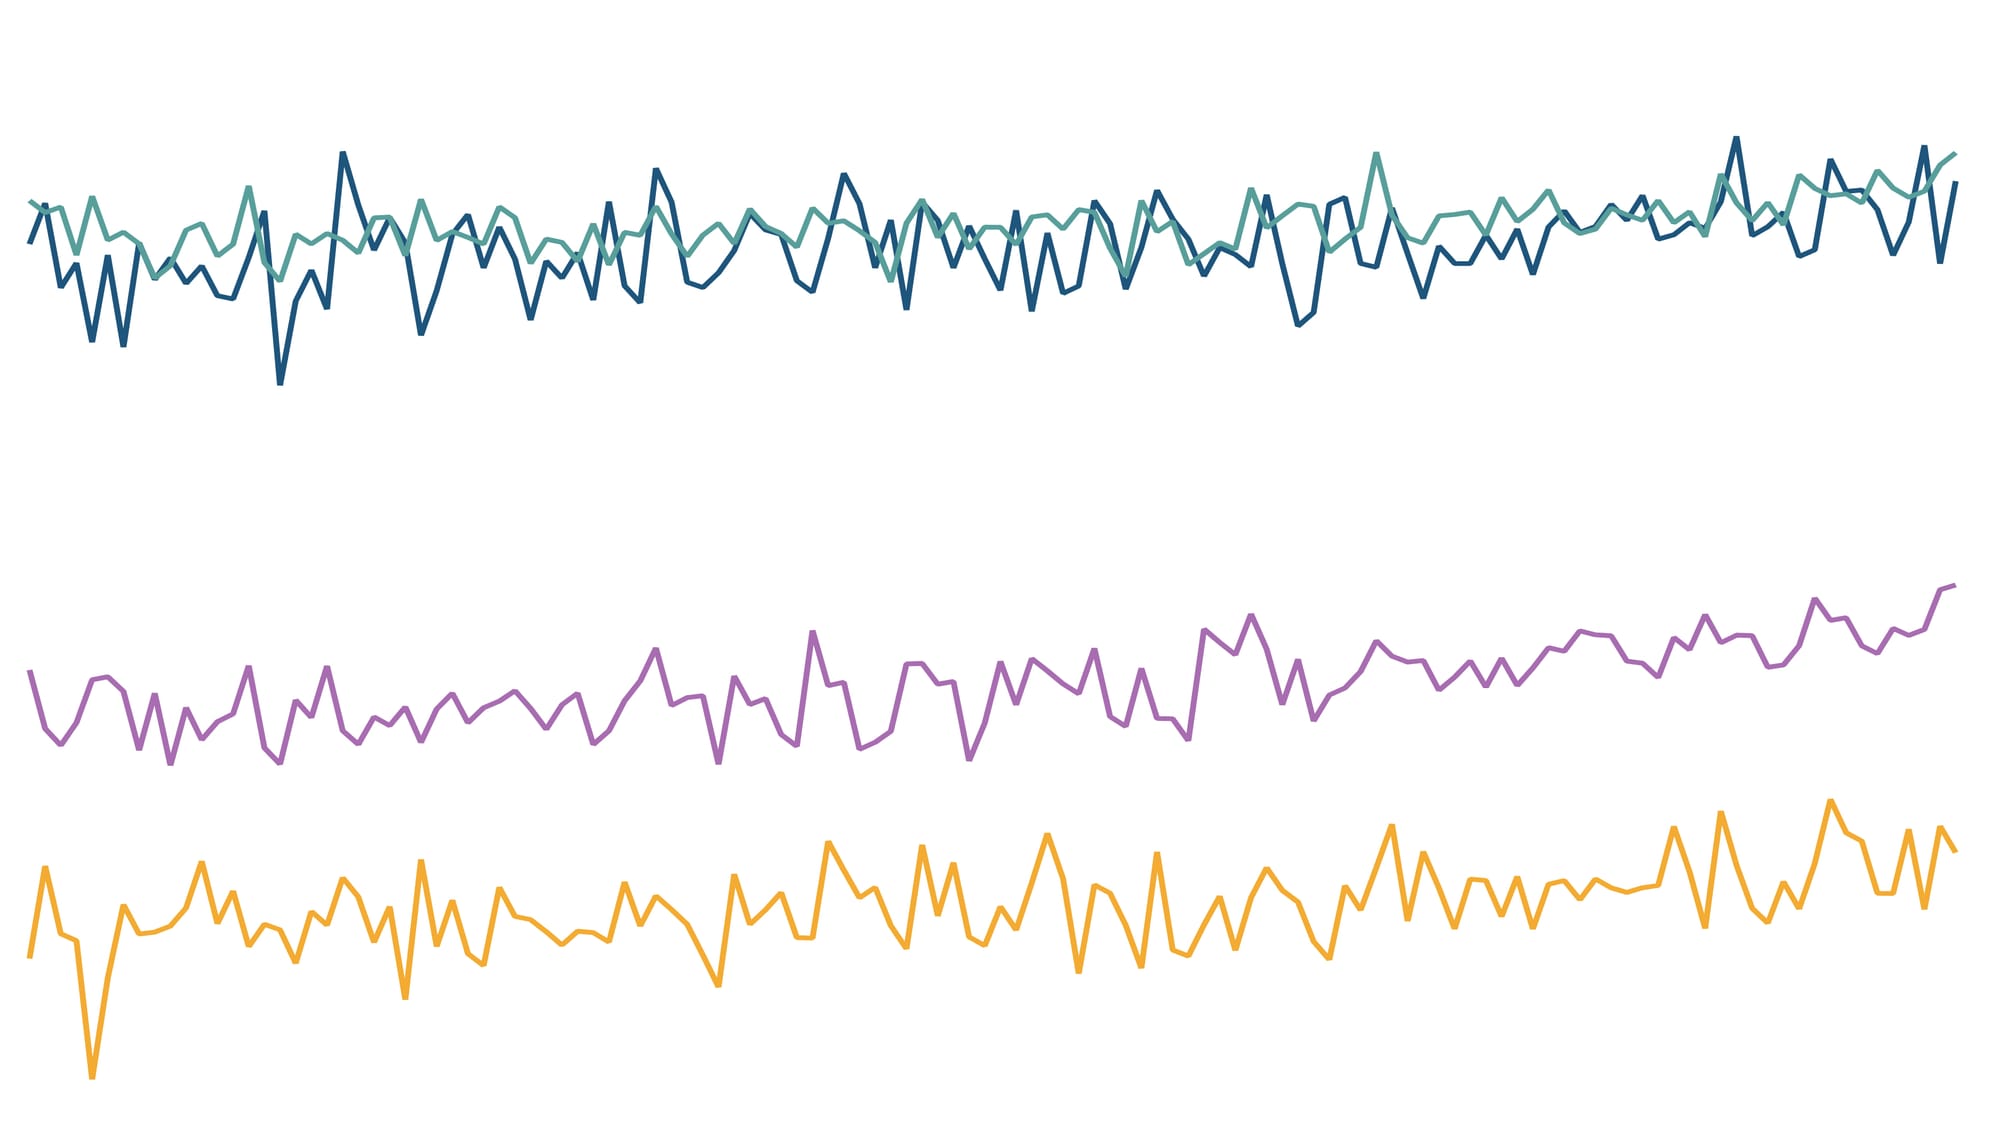
For instance, temperatures in India have become warmer over the long term, even though individual years continue to fluctuate substantially. We look at India's annual mean temperature from 1901 to 2024 at three levels of temporal averaging:
- Annual mean temperature: shows the mean temperature recorded in each year. The sharp movements from one year to the next capture short-term climate variability.[5]
- 10-year average: averages temperature of each year with those of the preceding nine years, reducing the influence of individual warm and cool years.
- 30-year average: averages temperature of each year with the preceding 29 years, providing a smoother measure of the longer-term temperature conditions.
The annual temperatures show substantial variability, but the longer-term averages have moved steadily upward. In the earlier decades, annual mean temperatures were around 24.4-24.6°C, although individual years could be considerably warmer or cooler. The annual series subsequently becomes warmer, with temperatures frequently exceeding 25°C post 1990. These year-to-year movements illustrate climate variability.[6] Such fluctuations are an inherent feature of the climate system and can result from processes operating over shorter timescales, including ocean-atmosphere interactions, monsoon variability and other natural influences. A particularly warm or cool year therefore describes a fluctuation in the climate, rather than necessarily indicating a long-term change in the climate itself.[7]
The longer averages reveal more persistent climate change.[8] The 10-year average also shows a pronounced rise towards the end of the record. It increases from approximately 24.4°C in the early decades to about 25.4°C by 2024, an increase of roughly 1°C. The 30-year average rises from approximately 24.5°C in the early decades to around 25.2°C in the early 2020s, an increase of roughly 0.7°C. Because the 30-year average is less affected by individual extreme years, this sustained increase indicates that the baseline around which annual temperatures fluctuate has shifted upward. This pattern is consistent with global observations of sustained warming associated with increasing greenhouse gas concentrations.[9]
The key difference between the three lines is therefore not simply the amount of fluctuation, but what each reveals about the climate. The annual line shows the ups and downs around the baseline, while the 10-year and the 30-year averages show that this baseline has progressively shifted upward. The fact that all three are substantially higher than their corresponding values earlier points to a persistent change rather than simply a sequence of isolated warm years.
Consensus on climate change
A frequent source of confusion in public discussions about climate change is the distinction between climate variability and climate change. The existence of natural fluctuations does not contradict climate change. The key question is whether these natural variations can explain the persistent warming observed over time, or whether other factors are driving the shift. Scientific evidence shows that natural variability alone cannot account for the warming observed over recent decades, with human activities now identified as its predominant cause.
The distinction lies in the scale and causes of the current change. According to the National Aeronautics and Space Administration (NASA), although the Earth's climate has experienced several cycles of warming and cooling over its history, the current rate of warming is unprecedented in at least the past 10,000 years.[10] Scientific evidence and academic research increasingly points to human activities as the dominant cause of current warming. The IPCC in its Sixth Assessment Report (AR6) concluded that "it is unequivocal that human influence has warmed the atmosphere, ocean and land".[11] The current warming is also exceptional when viewed against the Earth's longer climate history. The IPCC also finds that global surface temperatures have increased faster since 1970 than during any other 50-year period in at least the past 2,000 years.[12] The increase in atmospheric carbon dioxide is also occurring at a rapid rate with estimates suggesting that carbon dioxide emitted due to anthropogenic activities is increasing approximately 250 times faster than it did from natural sources following the last Ice Age.[13]
Both processes of natural variability and climate change therefore, operate simultaneously and interact with each other. Scientific evidence shows that human activities are now the dominant cause of long-term global warming, even as natural variability continues to shape temperatures and other climatic variables from year to year.
Why this distinction matters
Understanding the distinction between climate variability and climate change is essential for interpreting climate data and identifying long-term change. Natural variability continues to shape individual years, but persistent changes become visible when these fluctuations are examined over longer periods. Long-term records, appropriate baselines and multiple indicators therefore provide a more reliable basis for assessing climate change than individual events or annual averages. This distinction is critical for policy, helping inform decisions on adaptation, infrastructure, agriculture and disaster preparedness.
[1] Synthesis Report: Summary for Policymakers (2023), Intergovernmental Panel on Climate Change (IPCC).
[2] WMO Guidelines on the Calculation of Climate Normals (WMO-No. 1203), (2017). World Meteorological Organization (WMO); Intergovernmental Panel on Climate Change (IPCC) (2021), Climate Change 2021: The Physical Science Basis - Summary for Policymakers.
[3] Climate Change 2021: The Physical Science Basis (Annex VII: Glossary), (2021), edited by V. Masson‑Delmotte et al., IPCC.
[4] FAQ 3.2: What is natural variability and how has it influenced recent climate changes?(2021), IPCC, Intergovernmental Panel on Climate Change.
[5] Summary for Policymakers in Climate Change 2021: The Physical Science Basis (2021), Masson-Delmotte et. al, Intergovernmental Panel on Climate Change (IPCC).
[6] Summary for Policymakers in Climate Change 2021: The Physical Science Basis (2021), Masson-Delmotte et. al, Intergovernmental Panel on Climate Change (IPCC).
[7] FAQ 3.2: What is natural variability and how has it influenced recent climate changes?(2021), IPCC, Intergovernmental Panel on Climate Change.
[8] Synthesis Report: Summary for Policymakers (2023), Intergovernmental Panel on Climate Change (IPCC).
[9] Summary for Policymakers in Climate Change 2021: The Physical Science Basis (2021), Masson-Delmotte et. al, Intergovernmental Panel on Climate Change (IPCC).
[10] Evidence for Climate Change (n.d.), NASA Science, National Aeronautics and Space Administration (NASA).
[11] Synthesis Report: Summary for Policymakers (2023), Intergovernmental Panel on Climate Change (IPCC).
[12] Synthesis Report: Summary for Policymakers (2023), Intergovernmental Panel on Climate Change (IPCC).
[13] Changing State of the Climate System (2021), Gulev et al., Intergovernmental Panel on Climate Change (IPCC), Cambridge University Press.